This is a short adult introduction to Graph Theory,
hopefully easy and fun to read.
It's intended to acquaint you with basic concepts and vocabulary without too much mathematical formalism.
It's not a course.
There are no lessons, nothing to learn by heart, no grades, just Karol (and Triangle Kid answering questions)
faffing about graph theory in a relaxed setting.
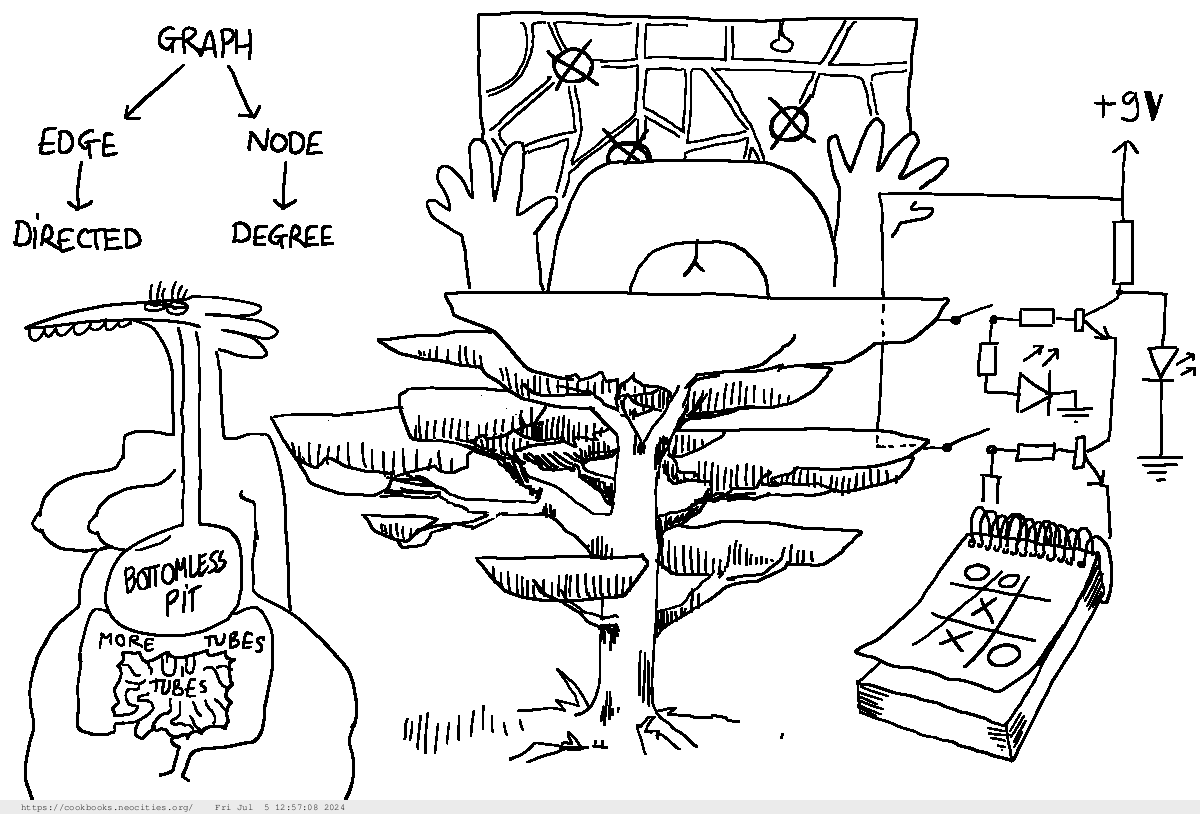
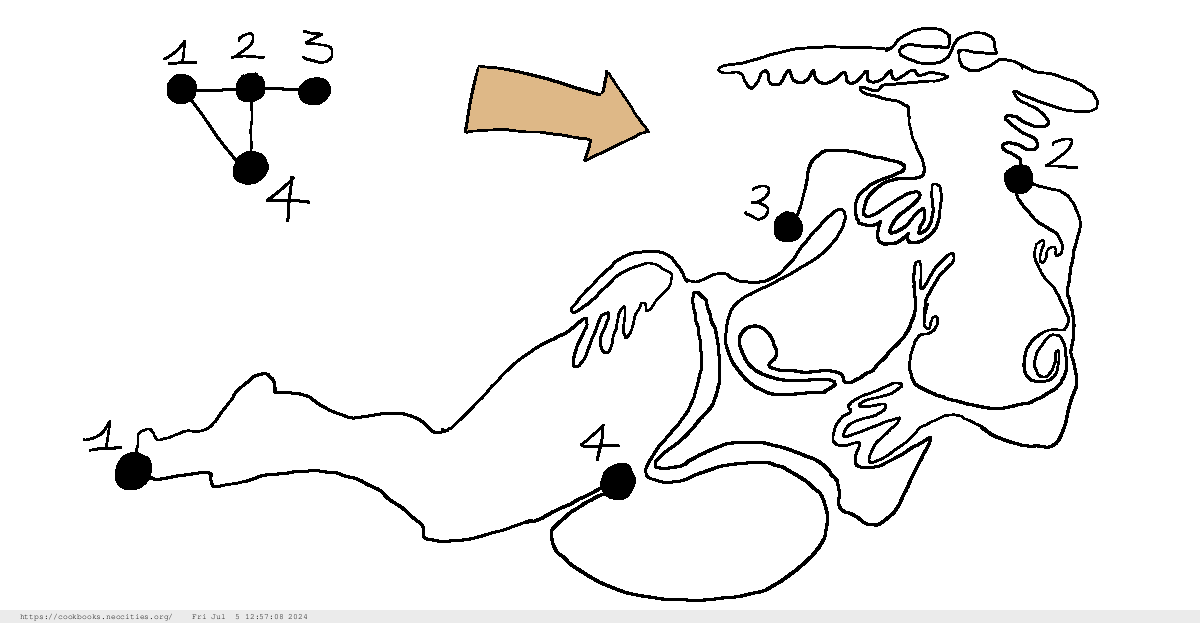
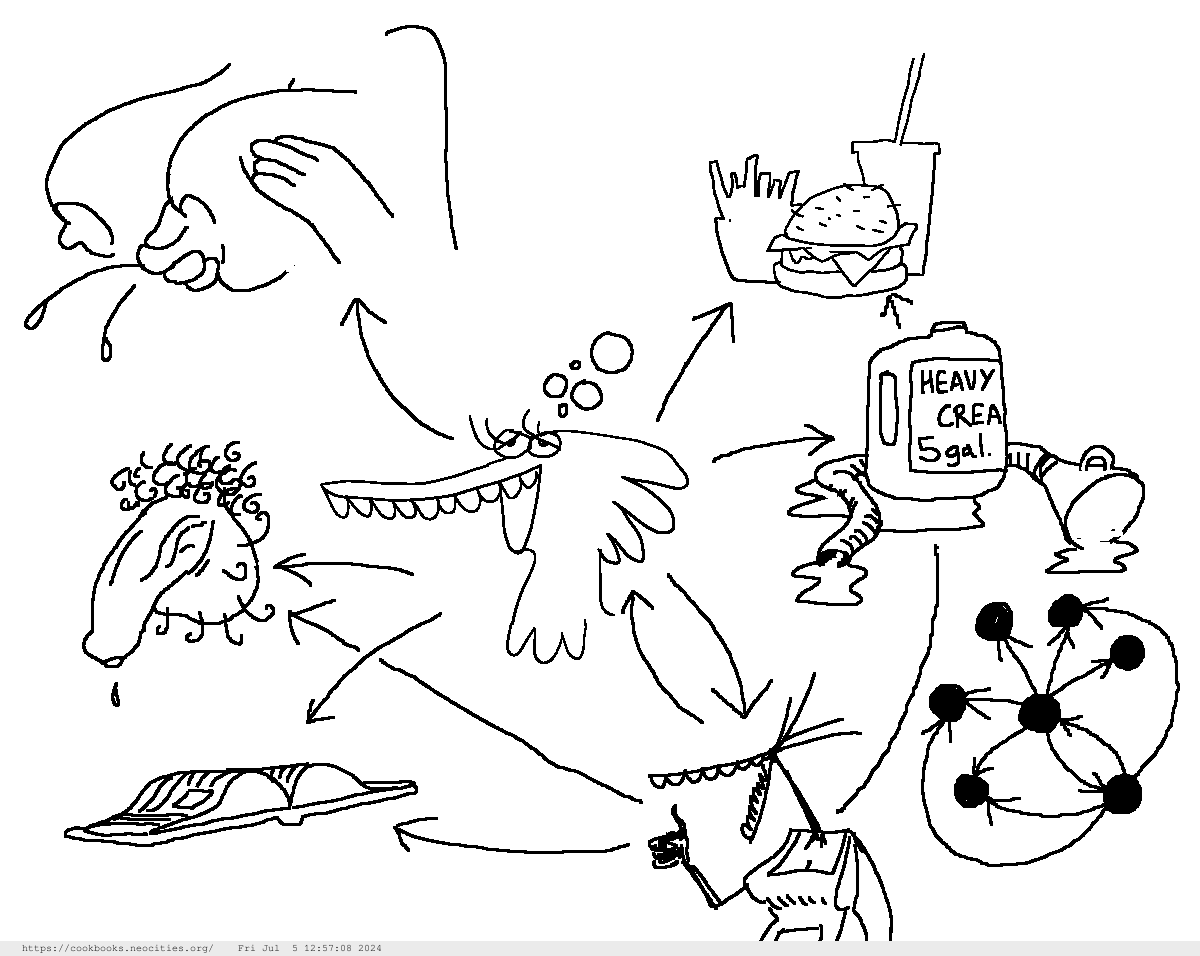
Now, look at all those different things.
a map of all the "All you can eat" diners in the town.
a tree.
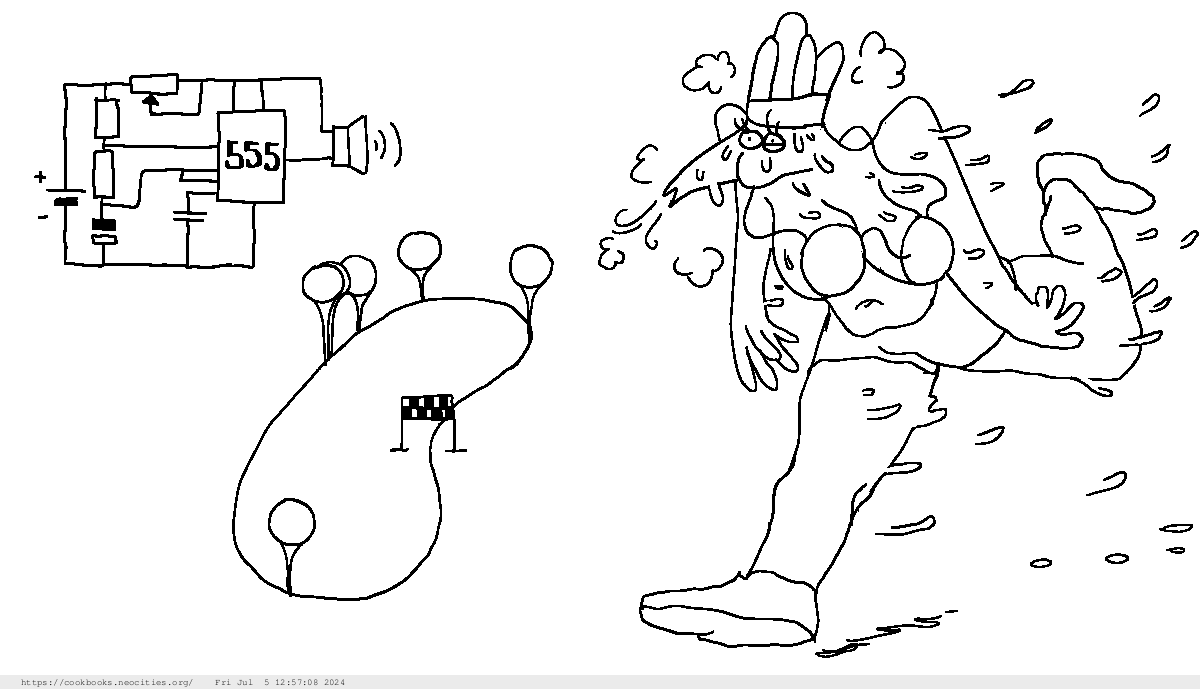
an electronic circuit.
Karol's digestive tract.
a taxonomy of some concepts in graph theory.
a tic-tac-toe board.
Many different things.
What's a common feature to all those things?
They can all be modeled as a graph.
Find another common thing to all these things.
They're all put together in the same example.
Find another common thing, you smartass.
What's modelling?
It is a way of describing a real life phenomenon or situation in simpler terms.
It simplifies the thing to describe so that it is easier to describe.
Ideally, even after simplifying the situation, we can use the model to:
explain what's happening in real life;
predict the future, or what will happen in real life, under certain conditions.
The fact that the model is simpler than what's happening in real life makes both of those things possible, and easier.
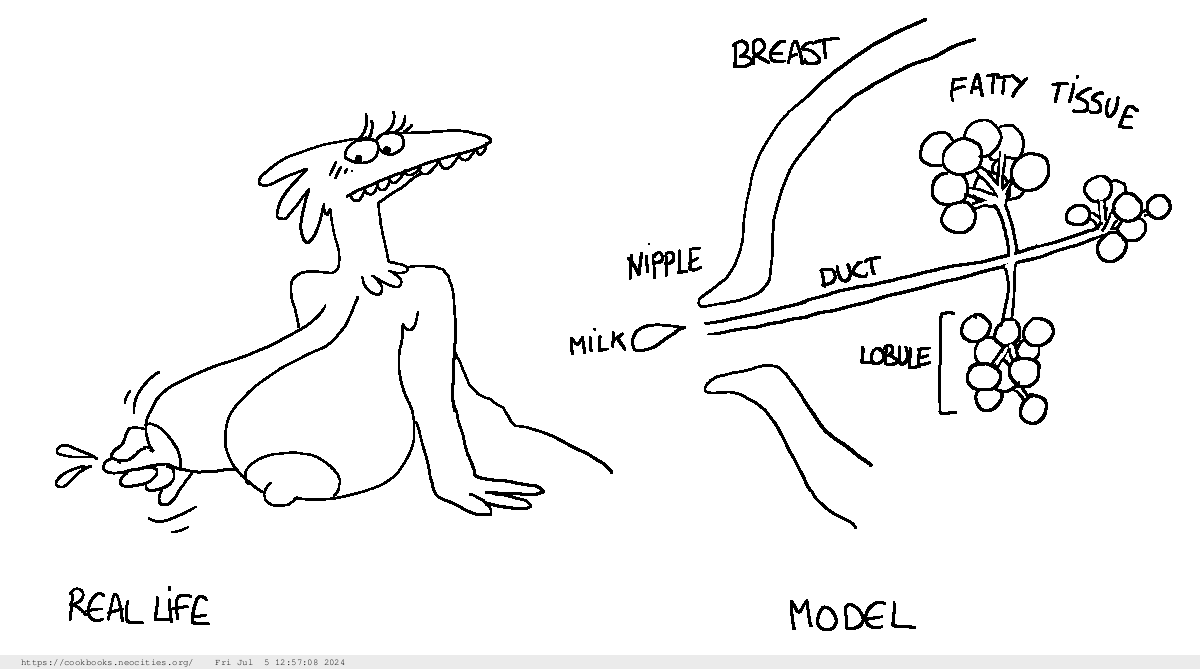
A real world thing next to a model of this thing.
It can be seen as a schematic, a map...
An abstraction of reality, something we have removed realism from
(in Latin, AB- (away) + TRAHERE (to pull) yields ABSTRAHERE, to remove, to pull away) -
or maybe something we have removed from reality?
A map is a model of real life, even if we often think they're one and the same.
Consider that: "A map is not the territory."
Scientists use weather models to try to predict if it will rain tomorrow.
The saying "after the rain comes sunshine" is a weather model.
It is not very accurate but it seems true.
"After the rain comes sunshine" can also be seen as a world model or a cognitive model,
not just a weather model.
Alright, but what's a graph?
Just two things:
a set of things;
a set of connections between any two of those things.
And what's a set?
You can understand them as a bunch of things described together.
The set of all food, the set of all integers, the set of all the socks in my house...
One important point: a set can be empty, which means it contains nothing. It's like an empty bag.
Does this mean a graph can be "empty"?
Yes; if the set of things is empty, the graph isn't very interesting: it's nothing.
It's also possible for the set of connections to be empty, in which case the graph is just a set of things.
Those aren't very interesting situations modelling-wise.
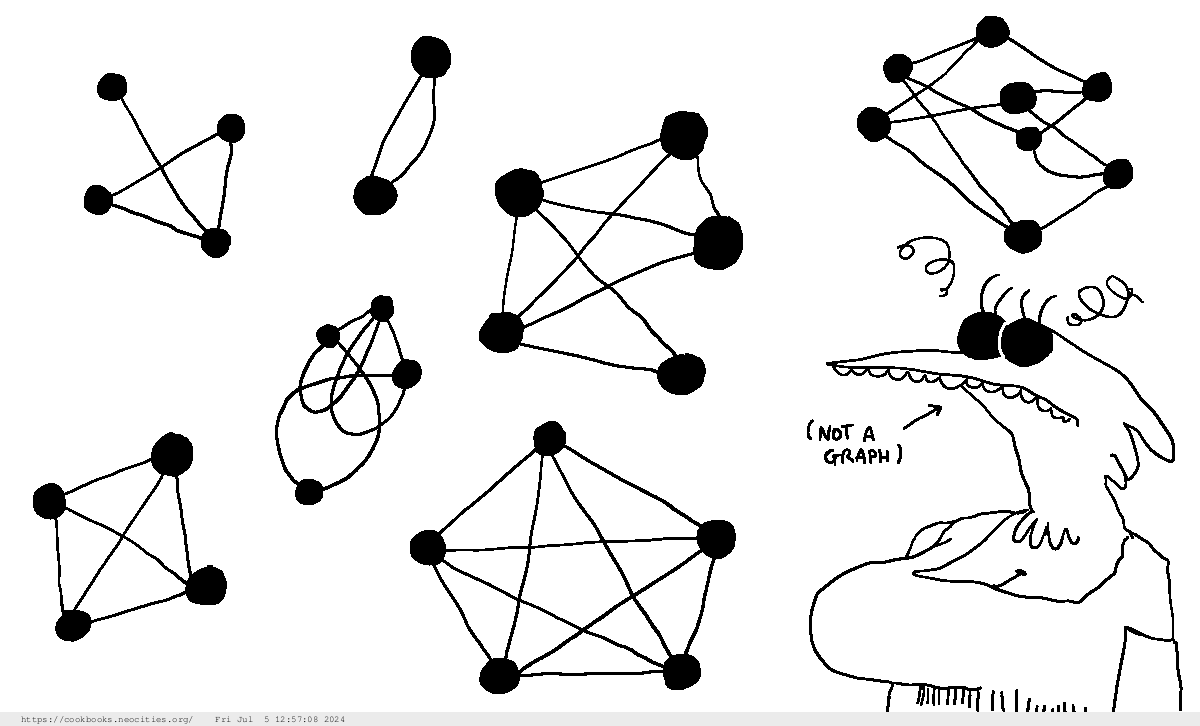
How do you draw a graph?
With fat points to represent the things,
and lines to represent the connections between the things.
Modelling real life with a graph can be much, much more complicated.
Step-by-step, you could
find out what are the nodes in the real life thing you want to model;
find out what the connections are;
draw them with fat points and dots;
go back to 1. and 2. if you've forgotten some things or added too many;
fiddle with the positions of the points and the lengths of the lines to make the graph more legible.
Drawing a graph step-by-step.
Making a graph legible isn't always possible. Drawing a graph without any lines crossing isn't always possible either!
We will talk about that later.
Can you draw the lines however you want?
Why yes, you can actually bend the lines however you want!
As long as the connections between things are kept and that it doesn't seem there are connections between things that shouldn't
be connected.
You can bend lines however you want, but keep it legible.
Can you stop using the word "things?"
In a graph, the things we represent are called nodes, or vertices (singular: vertex).
Think of them as knots on a string, as nodules in your lymphatic system, as pearls on a necklace, as intersections
in a city map.
The connections between things are called edges.
They're not really boundaries, but you can think of them this way if that makes you remember the word.
The edge cases. The edge of a cliff.
Microsoft Edge, which allows you to connect (hint, hint) to the web.
Geometers talk about edges when talking about the boundaries (sides) of a polygon, like the sides of a square.
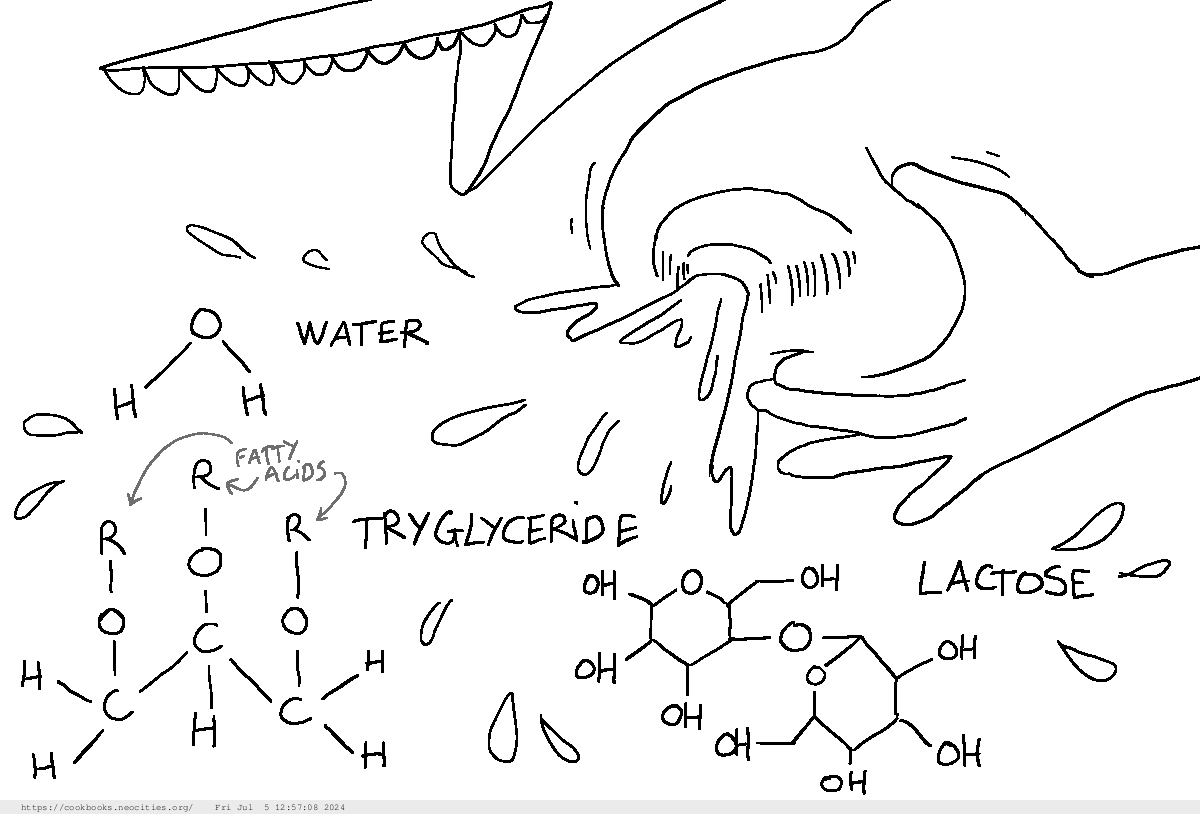
Why is it called a graph, anyway?
It comes from the mathematician Sylvester, who used it in 1878 in the context of chemistry.
He uses the term "chemicograph," which refers to diagrams that represent the constitution of molecules,
by drawing the atoms (the nodes of the graph) and the bonds between the atoms (the lines of the graph).
Chemicographs (modern "structural formulas) of some of the components in milk.
Note that some of the nodes have labels: they're "labelled".
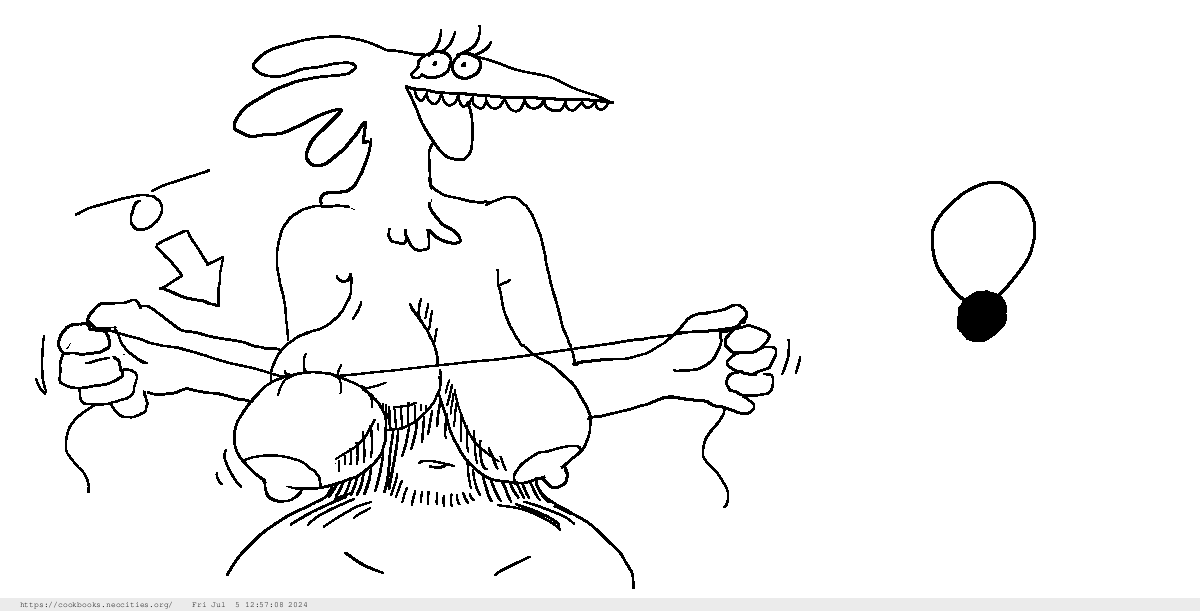
Can you really connect any of two of the nodes? No catch?
You can even connect the same thing to itself. It's called a loop,
probably because the shape you can draw it looks like a loop formed by a thin piece of thread.
A loop in a string and a loop in a graph.
Is that useful or interesting?
Sometimes yes, depending on the situation you model.
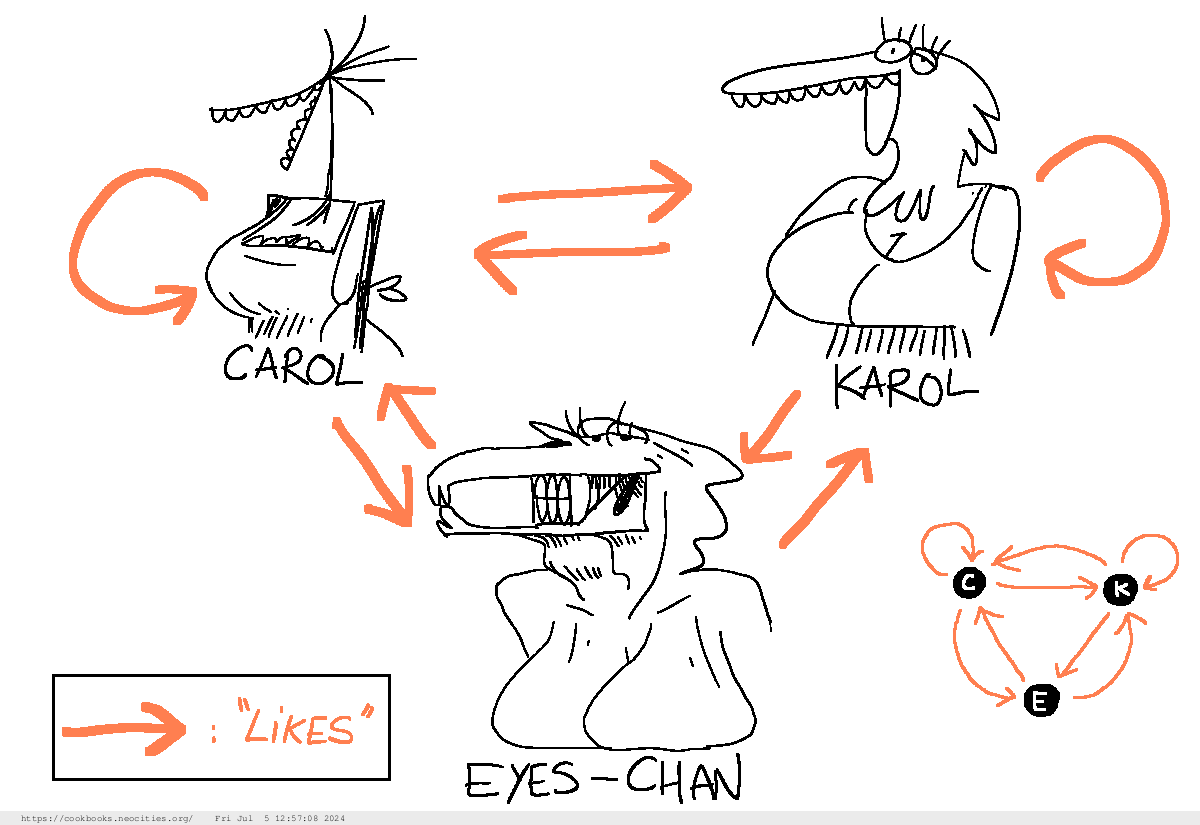
For example, you may want to describe how people like each other.
Someone who likes themselves will be subject to a loop.
In this graph, Karol and Carol like themselves, and like each other.
They also like Eyes-chan, who likes them back.
But the absence of loop in her node could mean that Eyes-Chan doesn't like herself. Sad!
Anything weird with the edges?
There can be multiple edges between nodes.
That's about it for now. You'll see later when it's really relevant.
Multiple edges between nodes. Looks cool.
In a map, the distances are pretty important. Is this the case with graphs?
Not necessarily.
Graphs are just things and connections between things, without any notion of distance.
They are a very general mathematical object.
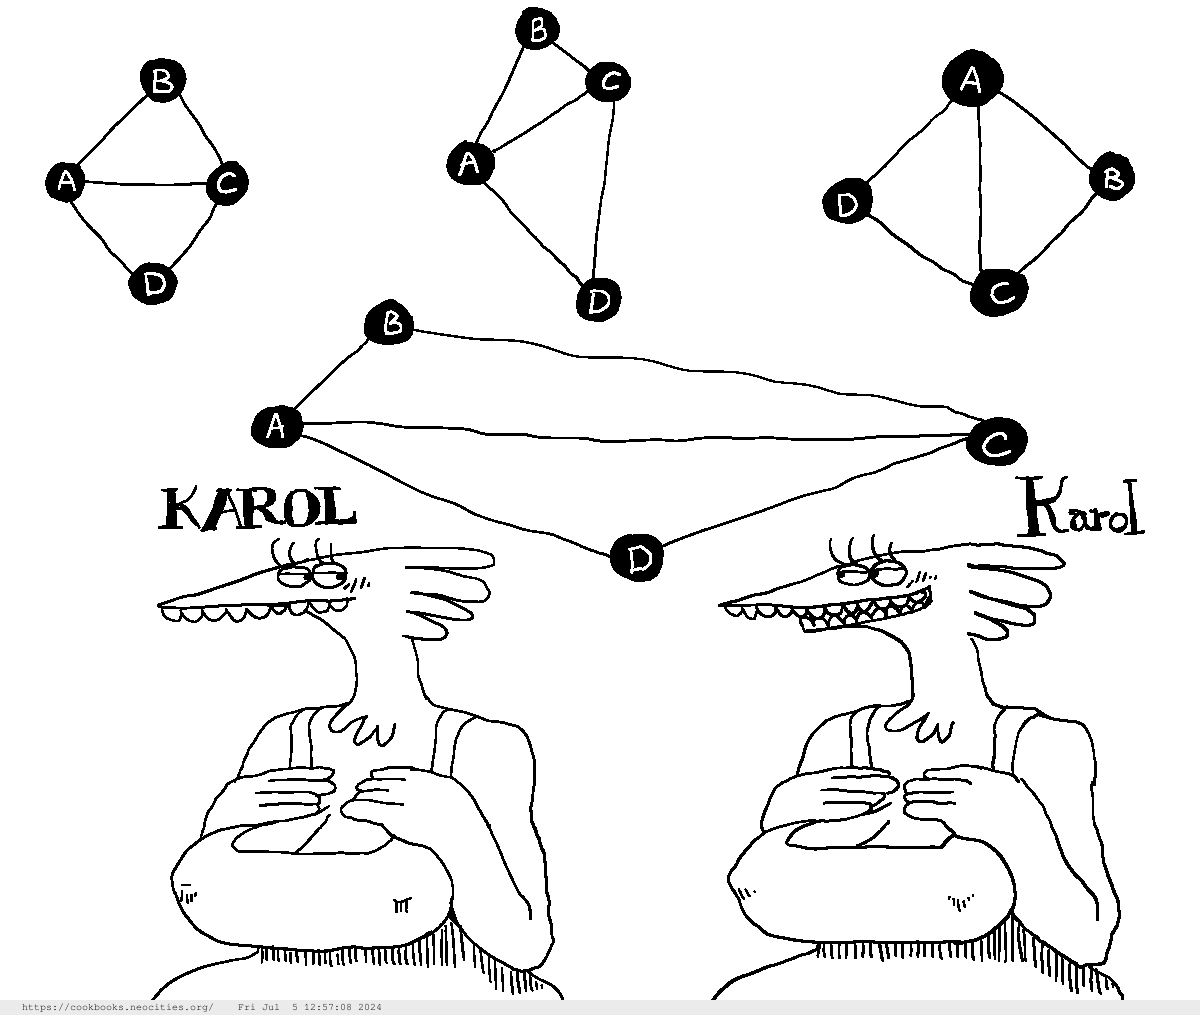
All of those graphs are the same : the nodes are the same and the connections are the same.
There are different ways of understanding "the same."
For now, they are "the same" in the same way "KAROL" and "Karol" are the same words.
They are different, but not in a way that matters to our specific purposes.
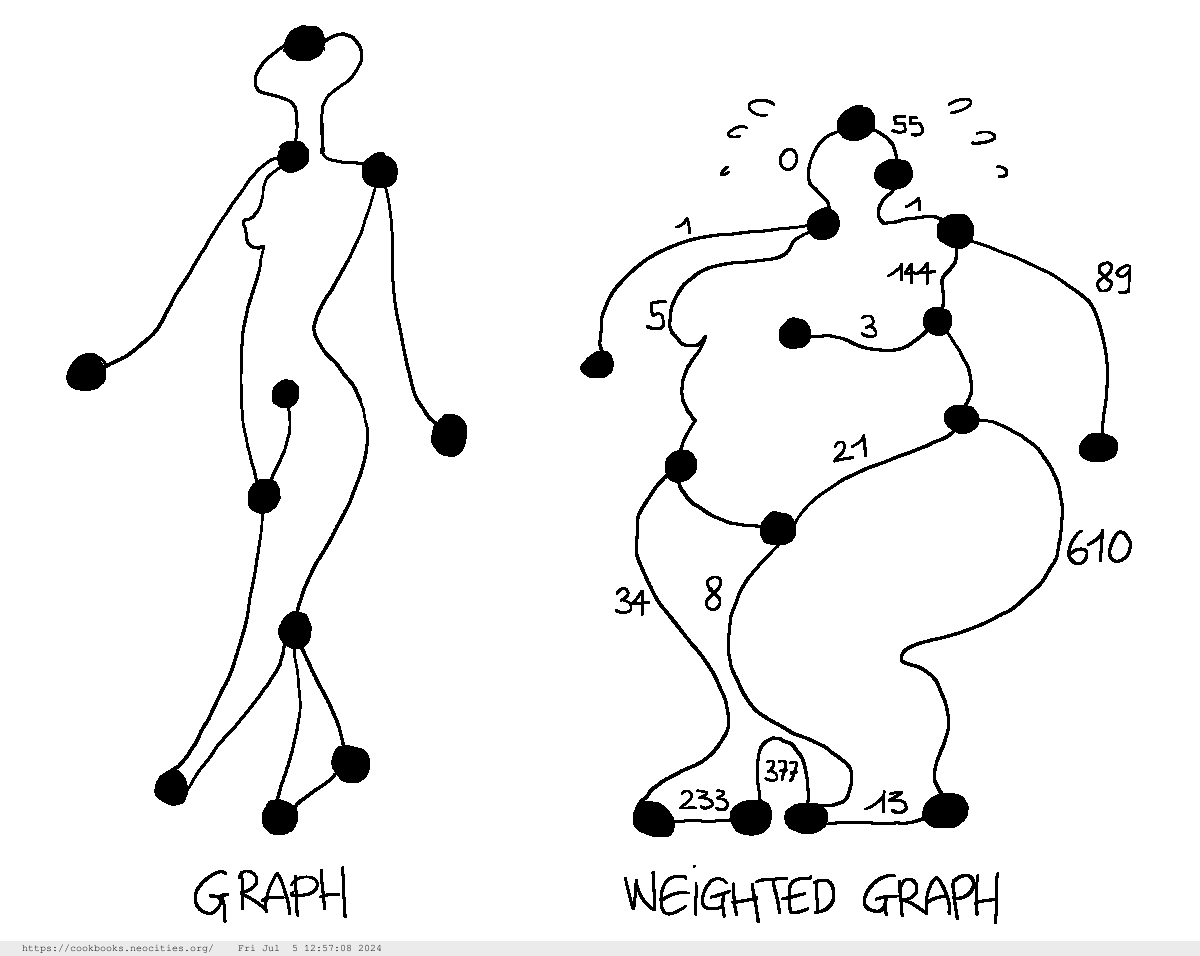
But we will see below that you can label a graph to put more information in it, such as distances (on the edges)
or amounts of available food (on the nodes).
Weighted graphs are a particular kind of labelled graphs, where the labels are numerical values, or "weights."
Special kinds of graphs
Graphs are a very general mathematical object,
but there are special graphs that have been studied so much they have specific vocabulary and concepts
associated to them.
Like weighted graphs?
Yes; weighted graphs are graphs with numerical labels on the edges.
What other kind of labels are there?
A whole lot. An important one is a simple (but full of meaning) arrow,
that gives a direction to the edge.
We call graphs with such arrows/directions directed graphs.
A love network is a kind of directed graph, in which arrows mean "(starting node) loves (target node)."
What about node labels?
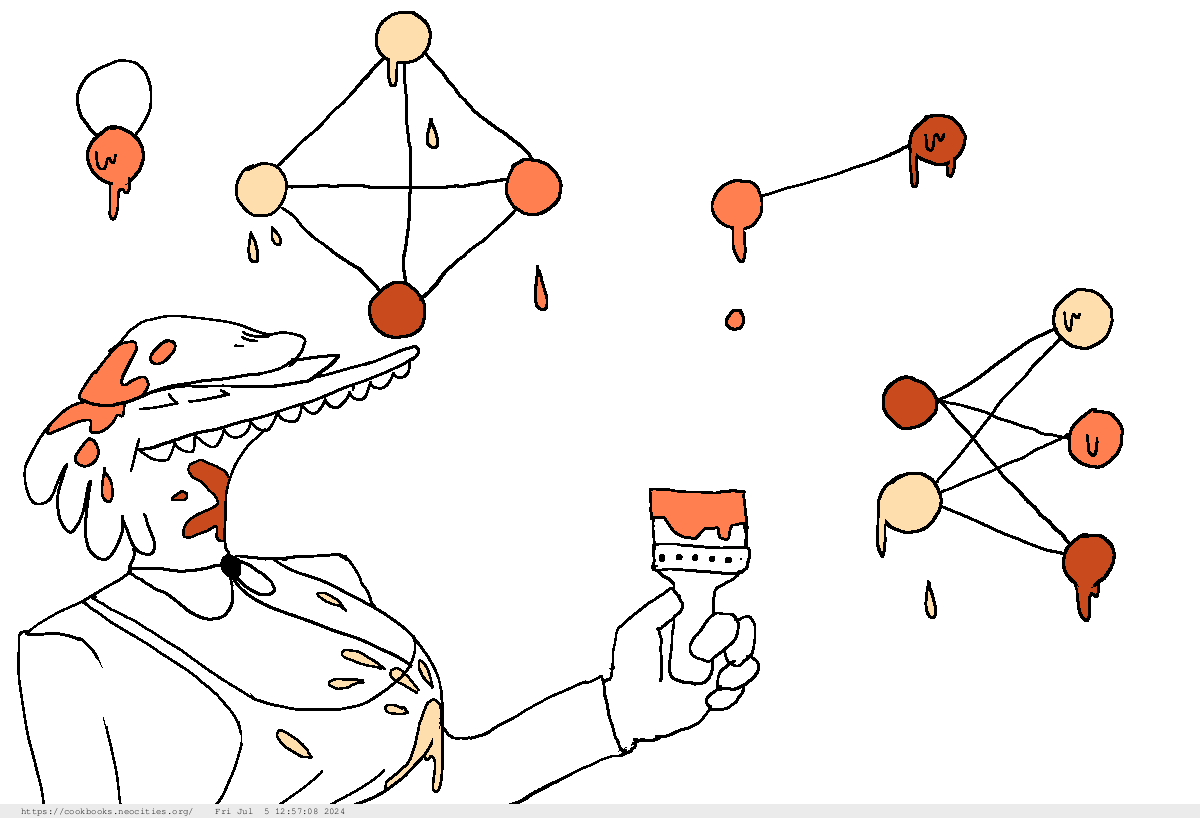
Well, apart from using text, mathematicians also color (or colour)
the nodes. You can choose any kind of color you want.
You can also write the colors using text - but that's prettier when you use colors or shapes.
Colored graphs.
Coloring a country map is pretty fun.
For an additional challenge, humans came up with additional rules.
The same colors cannot touch;
you have to use a minimal number of colors.
I get it: you'll turn that game into a graph problem.
Exactly. Graph coloring is pretty big amongst mathematicians.
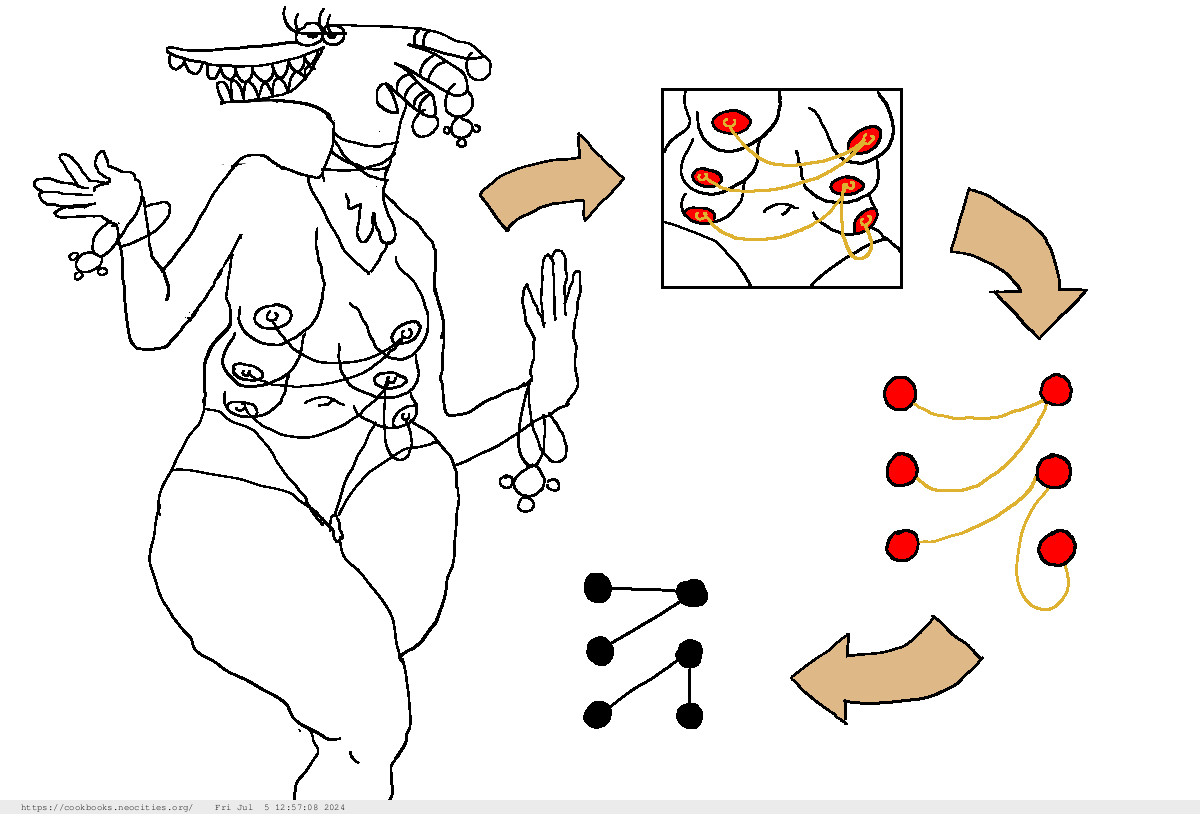
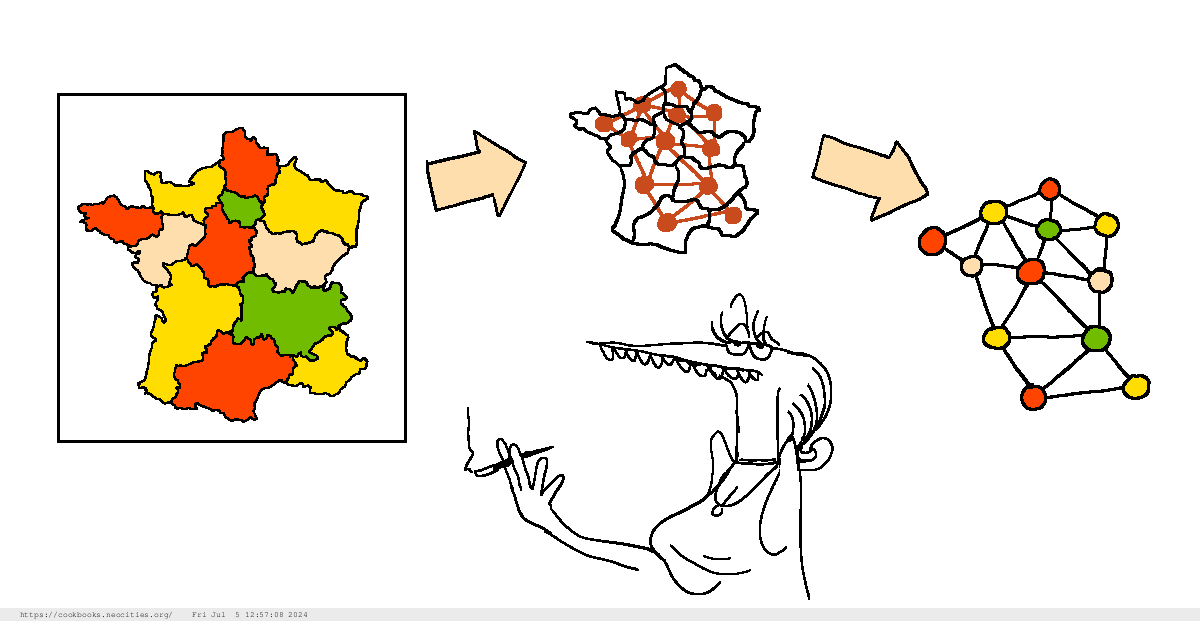
To go from a map to a graph, define the countries as the nodes;
add edges between two nodes whenever the corresponding countries touch each other on the map.
A colored map, and its corresponding graph.
By the way, the minimal number of color in a graph is called its chromatic number.
This comes from the Ancient Greek "χρῶμα" (khrôma - chroma), which means "color."
More important concepts in graph theory
Why are these concepts important?
Because researchers are using them.
Why are they using them?
Because they are abstractions (models) of things you can do in real life.
In a city, you can go from one "All you can eat" diner to another, and then another.
This makes a path in the city.
A path in a graph is the same thing: you go from one node to another, following the edges.
Sometimes, they aren't abstractions of things you can do in real life,
but researchers created them to simplify their models further,
or to give a name to a concept that appeared often in their models.
I don't have an example for this yet. Maybe later once we've reached more abstract concepts?
Getting around in a graph
So, what's this about paths and travelling in graphs?
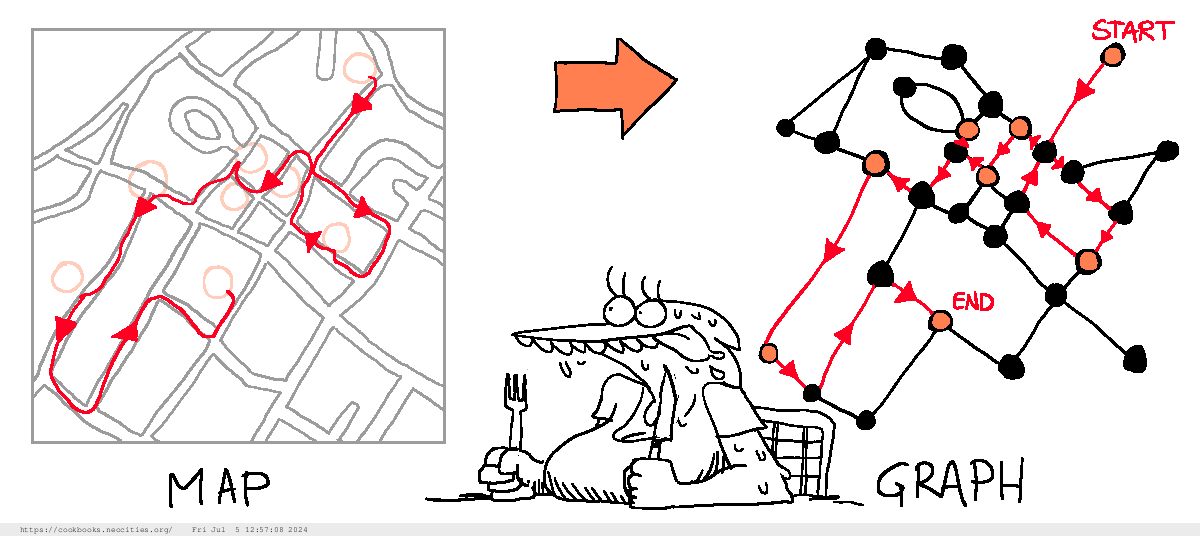
Path, or walk, are the terms used to refer to ways to go from node to node in a graph.
Like walking (or driving) from city to city in a cross-country trip, we traverse the edges of the graph
and visit the nodes one after the other, starting from a chosen point (the start).
A path between all the restaurants in a city versus the corresponding graph.
Can you spot the modelling decisions that have been made here? Would you have done things differently?
Then why is it called a walk and not a drive?
I don't know. Perhaps because graph theory terminology was invented before cars.
Maybe you can suggest it to the Annual Congress of Mathematics Terminology.
If the Congress doesn't exist, create it first.
I'll go to Congress and ask them that. Then I'll get back to you.
Get back to me...
This illustrates another graph theory concept:
if you end your path at the same node you started it,
we call it a ciircuit.
Some examples of circuits: an electric circuit, a race circuit, circuit training.
Cycles, on the other hand, disallow visiting the same node twice.
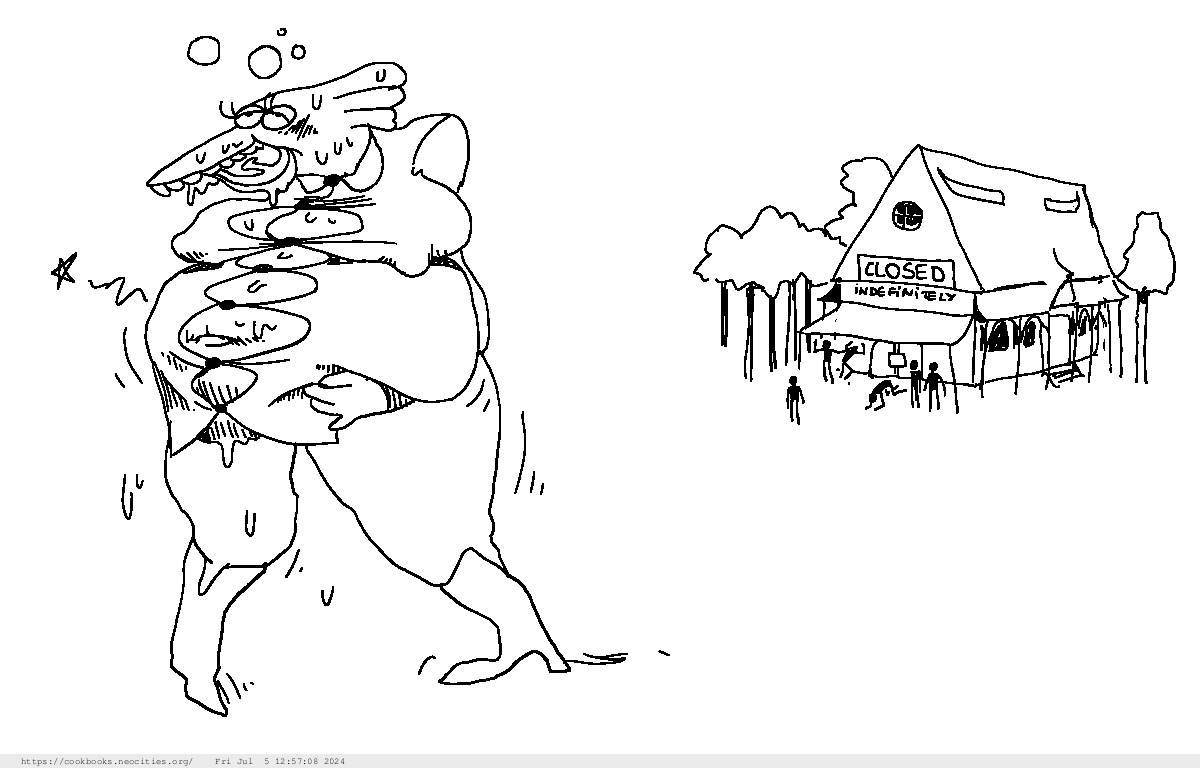
Karol frequently visits "All you can eat" restaurants
but never more than once.
I've actually seen circuits being called cycles and cycles being called circuits.
Well damn, how do I know which one people are talking about?
Generally, they remind you of the definition of the term they use,
especially in big, well-known graph theory problems.
What's more important, I think, is to be acquainted with concepts,
with ideas,
rather than being attached to a specific terminology;
even if a homogeneous and harmonized terminology does make communication easier, of course.
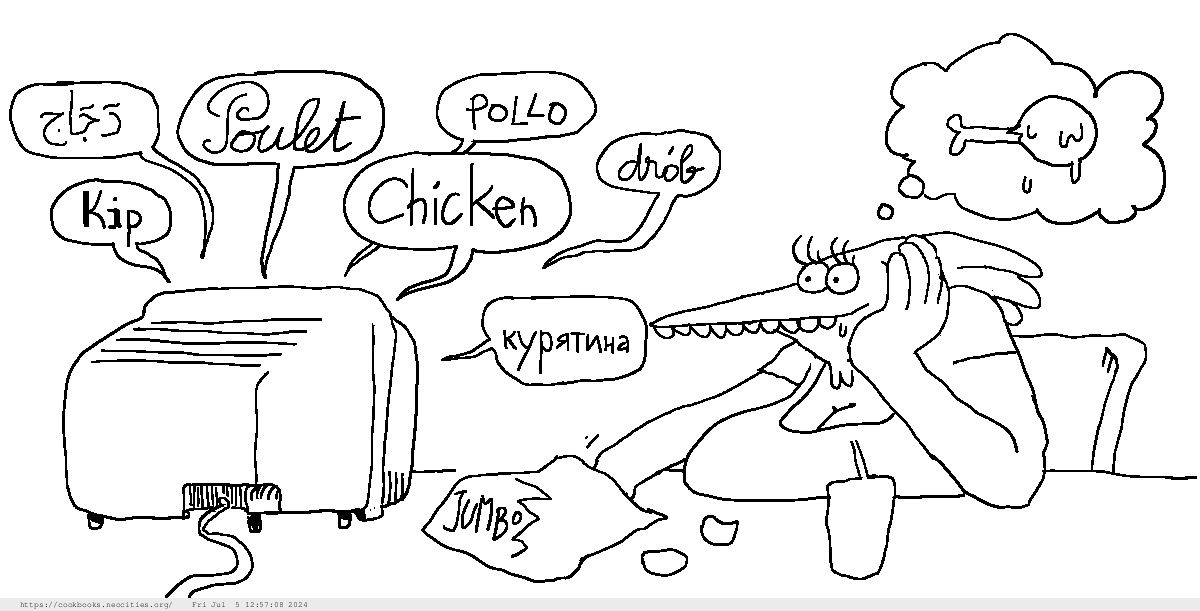
Learning different terminologies is kinda like learning different languages,
and you can always come back to the (universal?) base concept you have in your mind (or a drawing).
What happens if the graph is directed, you know, the one with the arrows?
You have to respect the direction of the arrows when you walk from node to node; other than that it's not much different.
This is where multiple edges come into play, if you want to indicate explicitely that you
can go both way on an edge.
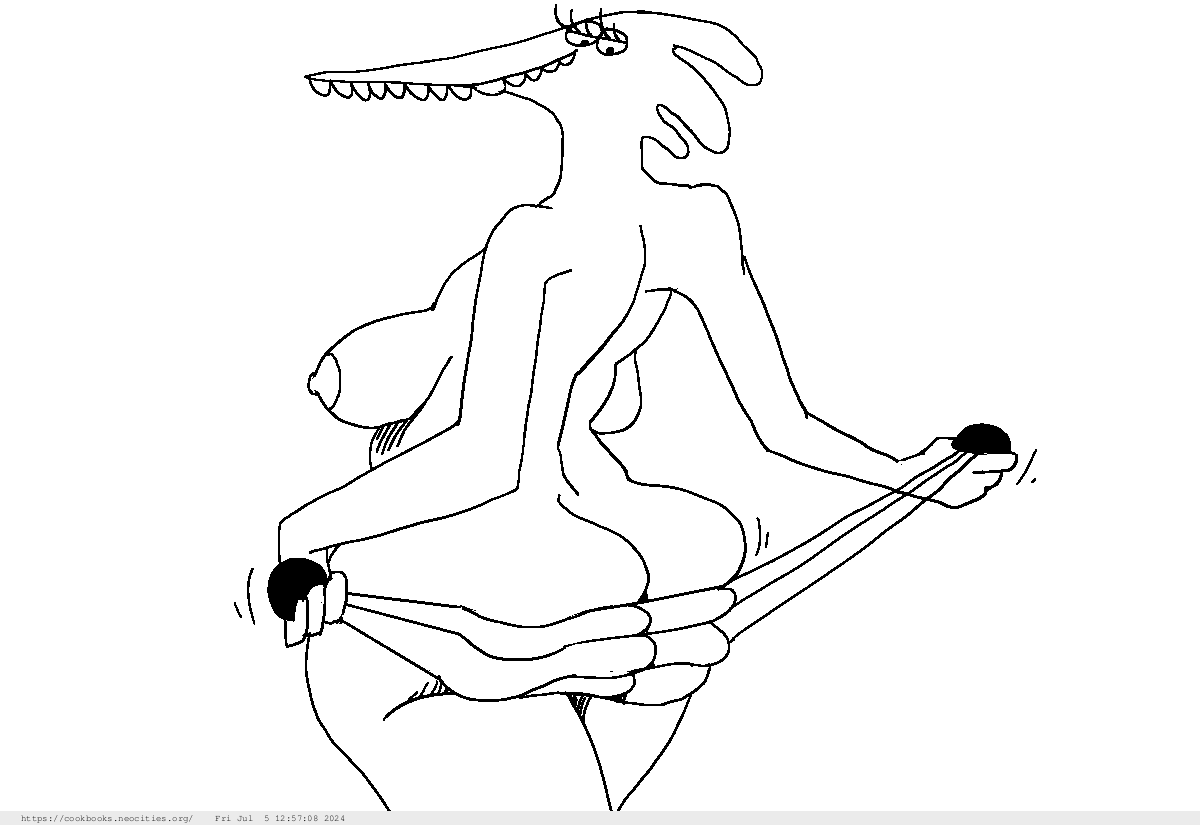
An application of multiple edges. You explicitely indicate you can go both ways and,
sometimes, you indeed can't go both ways when there is only a single direction possible.
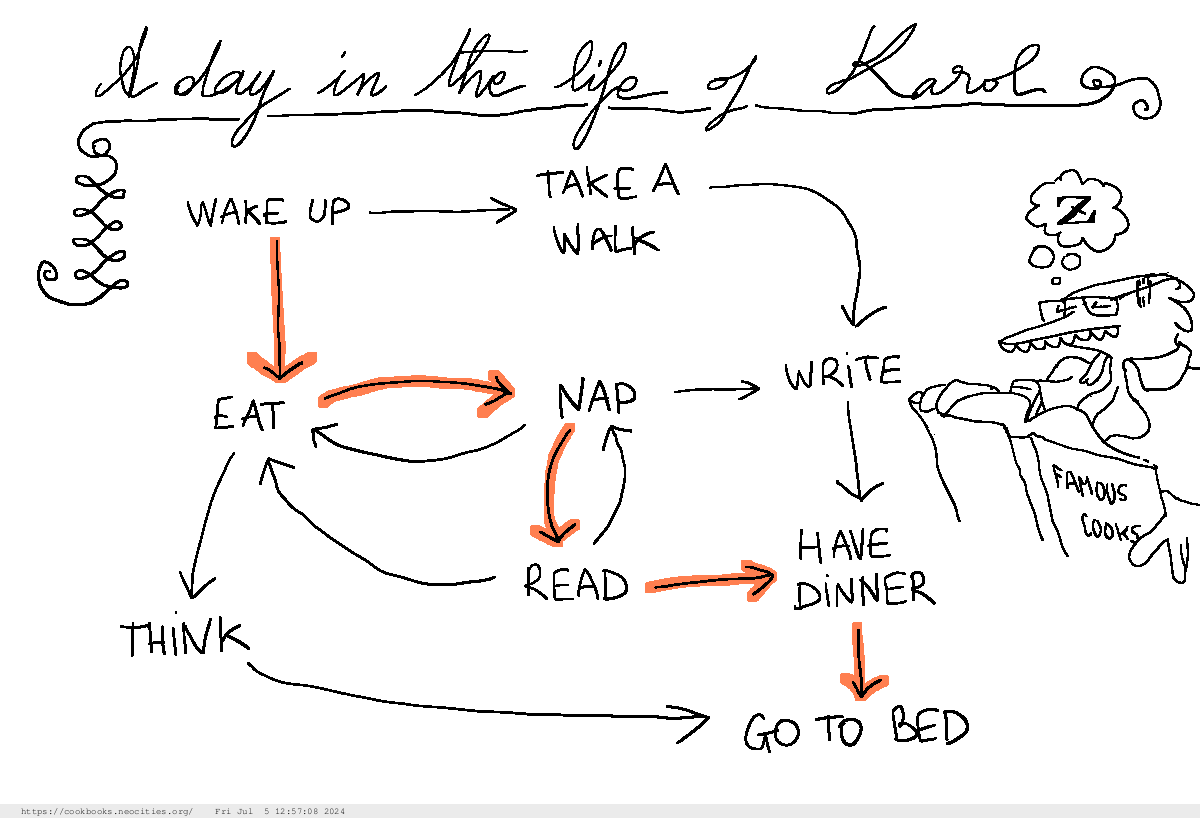
In colors, I have shown a possible path in the graph: starting from the WAKE UP node, then
EAT, NAP, READ, HAVE DINNER and, finally, ending at the GO TO BED node.
General results on graphs
General results?
Mathematicians are sometimes interested in general rules that can apply to a whole lot of things at once.
What is interesting is that these rules can be abstract, and be totally removed from what you wanted to model at the start!
I think it's a double-edged sword: you forgot what material, real considerations lead you to consider
graphs (or any kind of mathematical object for that matter).
On one hand, you "declutter" the problem of any "unnecessary" things;
on the other, you might forget what it means to be human why it is you studied the problem in the first place
and even forget, purposefully or not, ethical dilemmas raised by the accomplishment of your science.
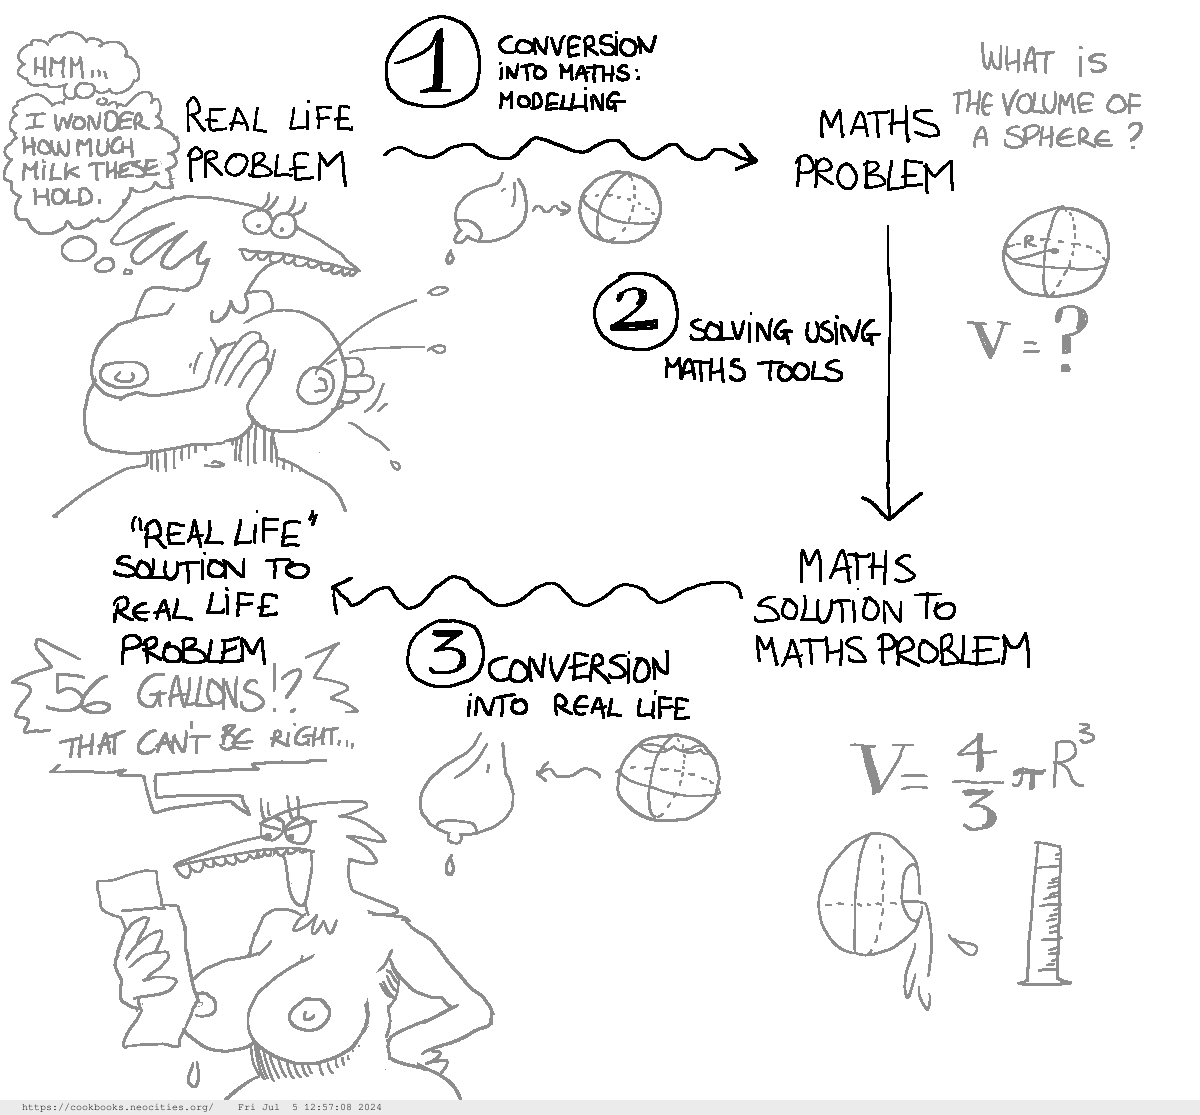
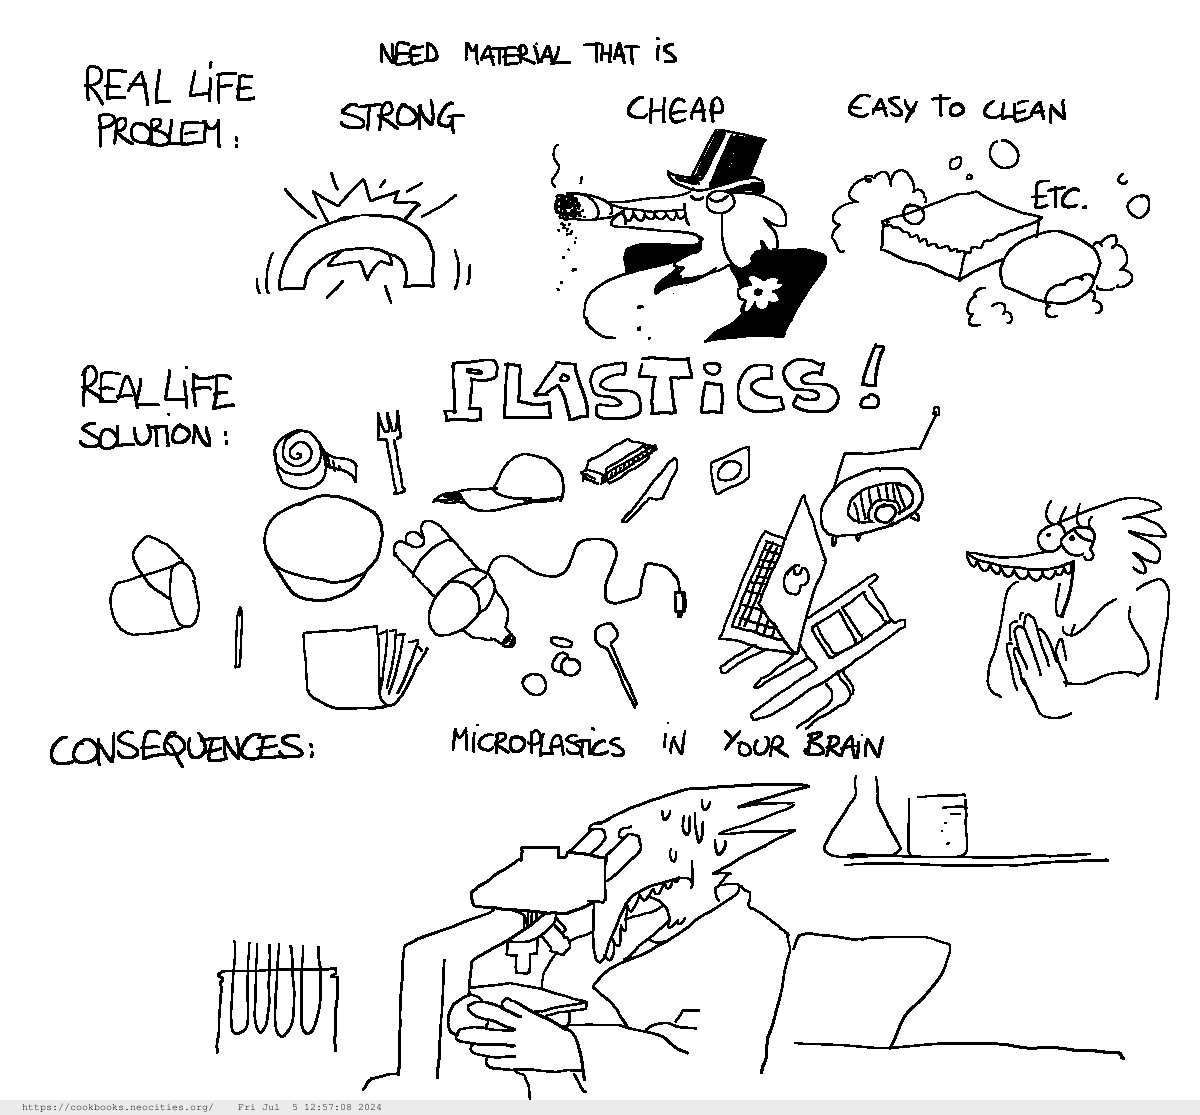
A diagram that sums up the use of models. This diagram is a graph, by the way.
Forgetting that things may go wrong at every step 1, 2, or 3,
and thinking that the "real life solution to real life problem" obtained
this way is really THE solution or even the BEST solution to the real life problem
can yield unforeseen negative consequences.
Try to come up with at least three different possible errors Karol made.
Also, this is not restricted to maths.
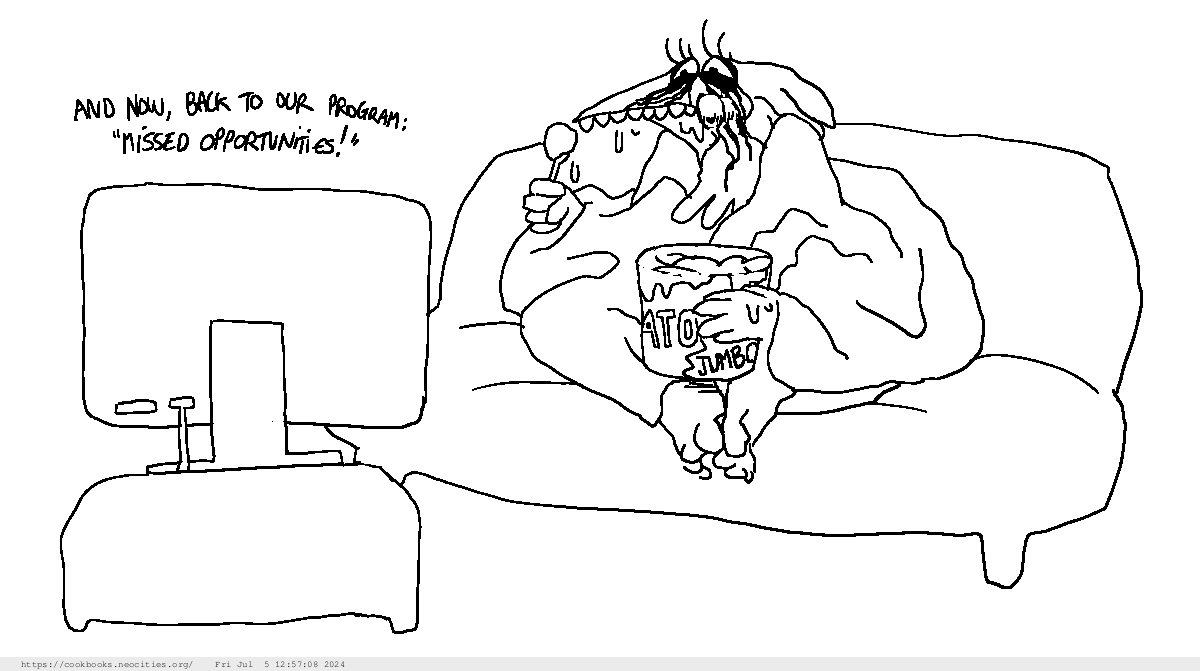
Microplastics in your brain (not historically accurate).
How "unnecessary" are these things?
Wouldn't you need drive, inspiration to solve a problem?
They're unnecessary in the sense that, in purely mathematical and logical terms,
you don't need them to demonstrate the rules.
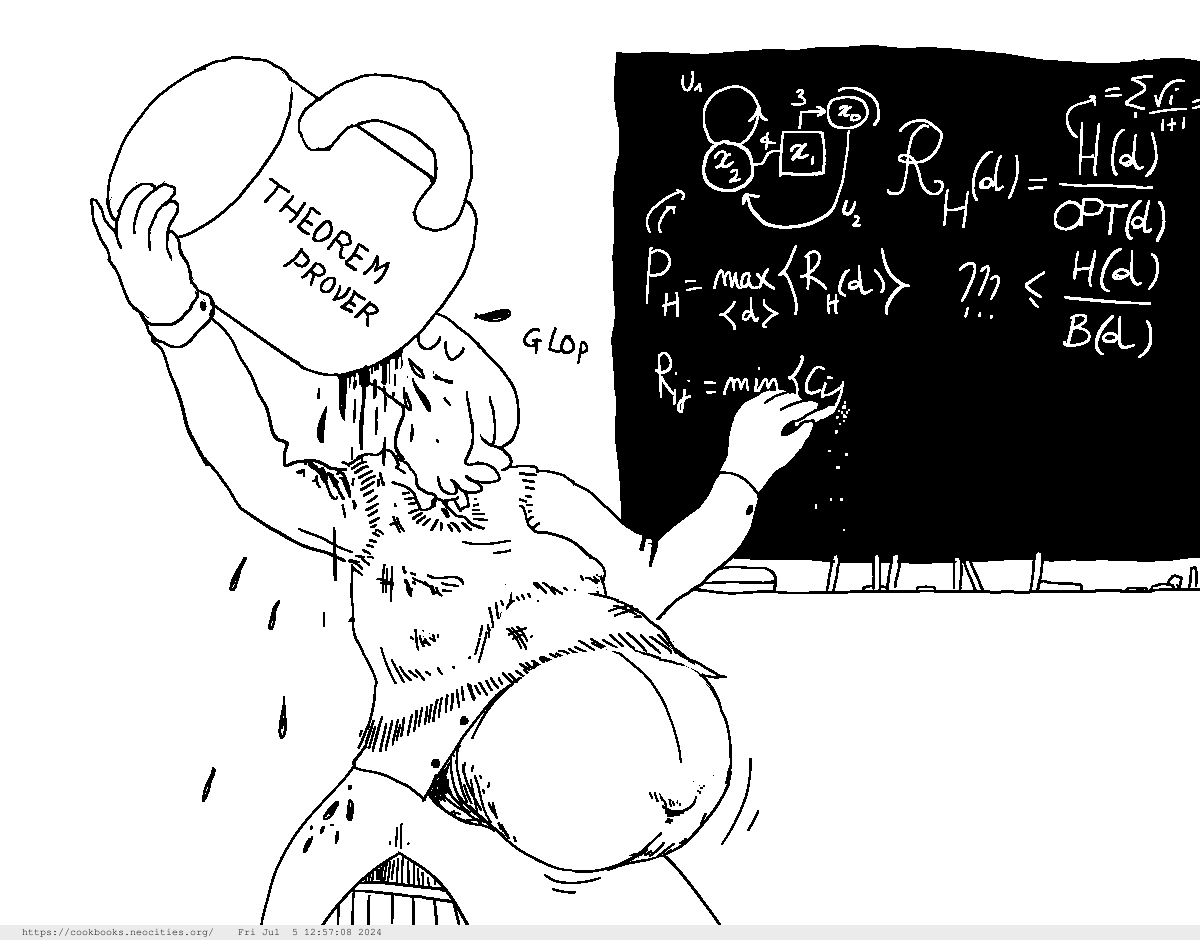
Some people actually use machines to solve Step 2 in the diagram above.
Mathematicians need much more than logic to demonstrate things, such as coffee or tea.
Planar graphs and the Three Utilities Problem
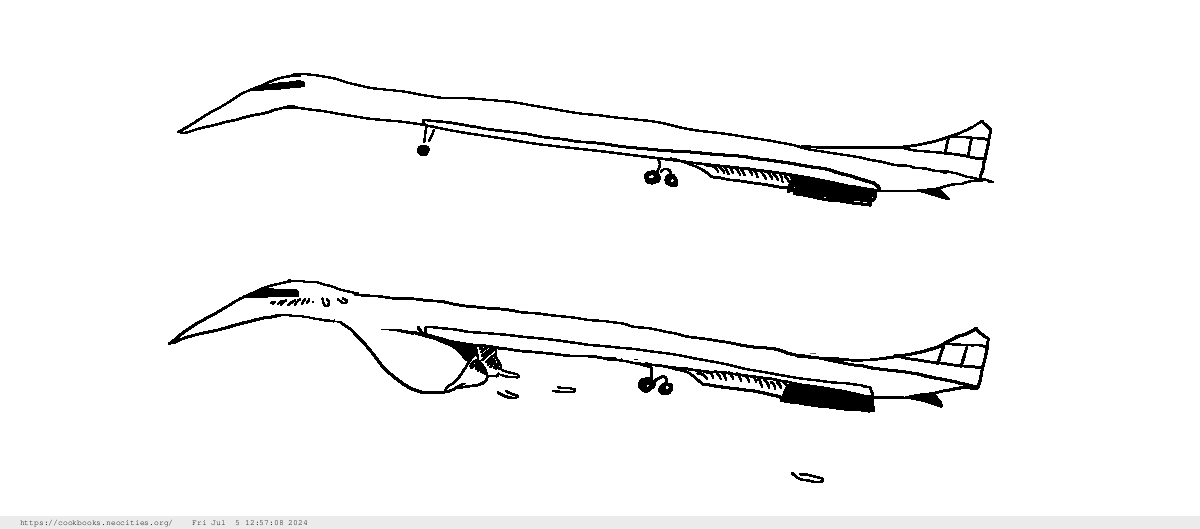
Planar... Is this related to planes?
Well, plane, and maybe airplanes too,
may come from Latin PLANUM, which means something flat.
When you draw a graph, it's usually on a flat surface like a sheet of paper.
But sometimes you draw edges that cross each other.
A flat airplane and a non-flat airplane.
Didn't you say that I could draw edges however I want?
Yes, and sometimes you can move around some nodes so that no edge cross.
Graphs that can be drawn without edges crossing are called planar graphs,
because they can be drawn onto the flat surface of your sheet of paper.
You can move around nodes to remove edges that cross each other.
Yet, some graphs cannot be manipulated this way.
No matter how you move this graph's nodes on the plane, you won't remove all the edges that cross.
So, what's the solution? Portals?
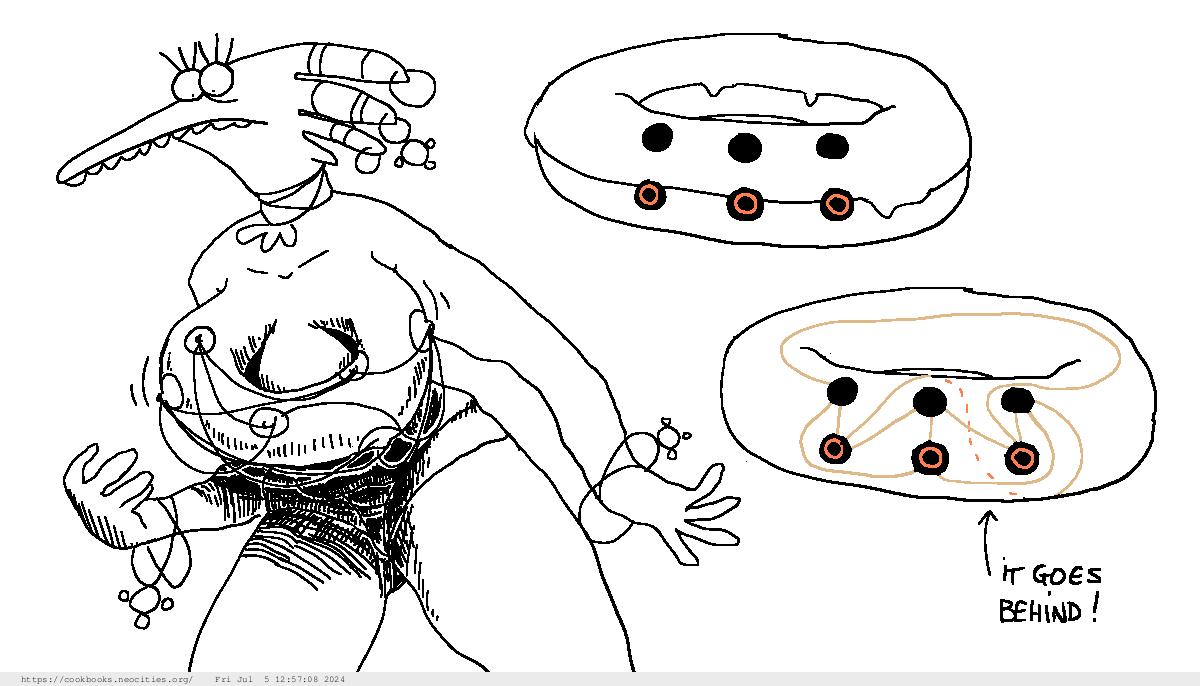
Portals, or drawing the graph on shapes that are not planes and sheets of paper, such as
a donut (also called a torus, but mathematicians use the term "donut" all the time anyway).
You can draw the graph above on a donut without any edges crossing.
These are special 3D shapes which are, in a way, flat relative to themselves,
but who "live" in a 3D space. This is similar to tattoos, which are "flat" onto your skin,
and yet you are a 3D shape.
This is also akin to Earth: we live on a (mostly) flat world, and rarely have to think about the spherical nature of the Earth.
This 2D Karol is flat with regards to her Flatlandworld, but that world is a 3D shape (a spheroïd).
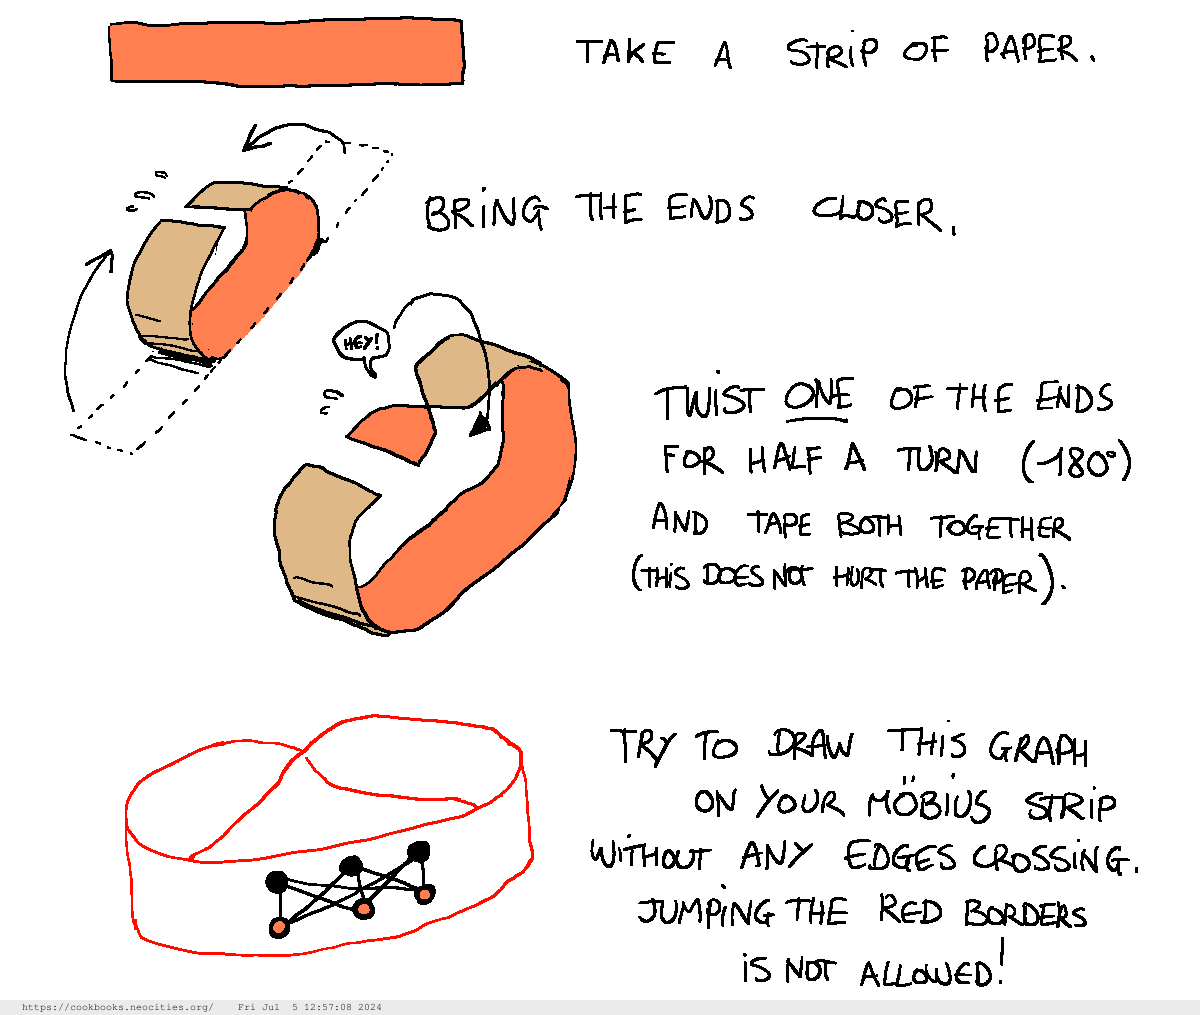
Build a Möbius strip using a ribbon made out of paper and try to draw the donut graph
without any lines crossing. Hint: take inspiration from the solution for the donut graph.
How to make a Möbius strip.
So if I don't know if a graph is planar,
I should move every node around to check if I can uncross them?
It's a pretty fun game
if you know the graph is planar.
But if you don't know,
and if the graph is very big,
I agree that it can become very, very complicated to check.
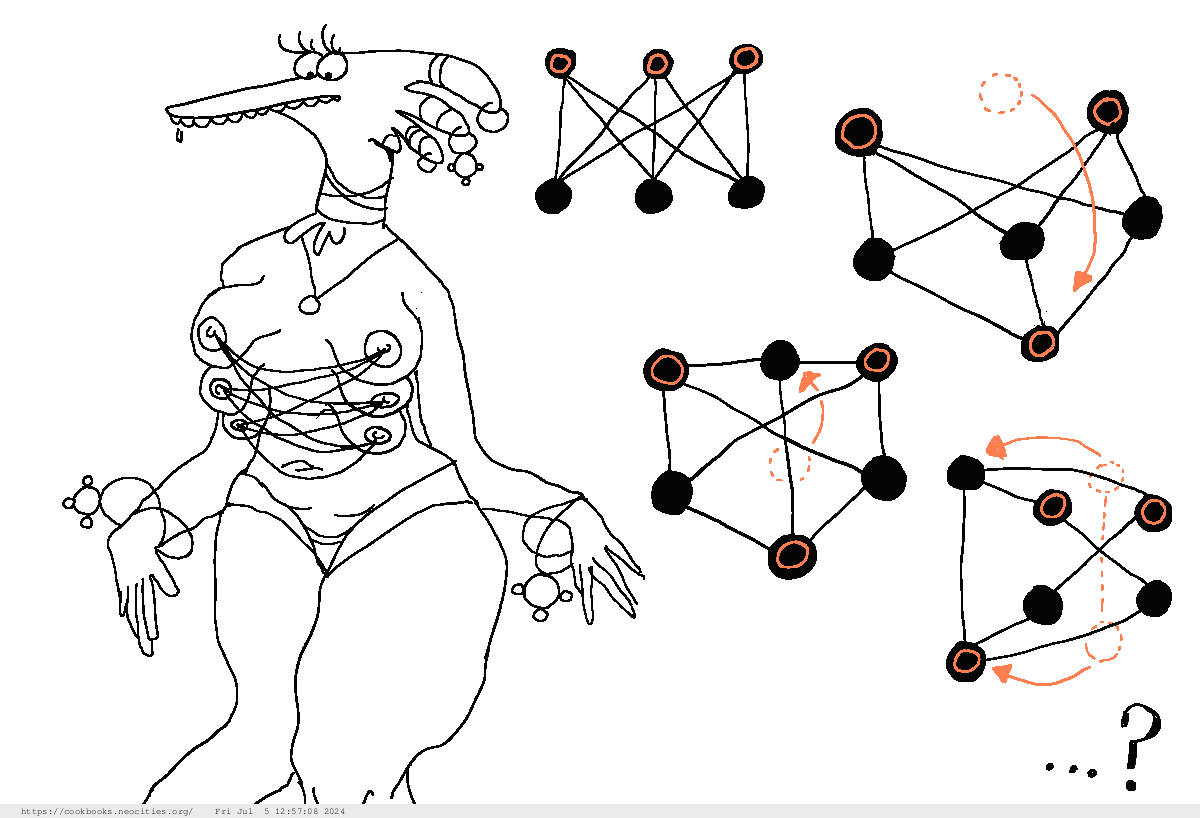
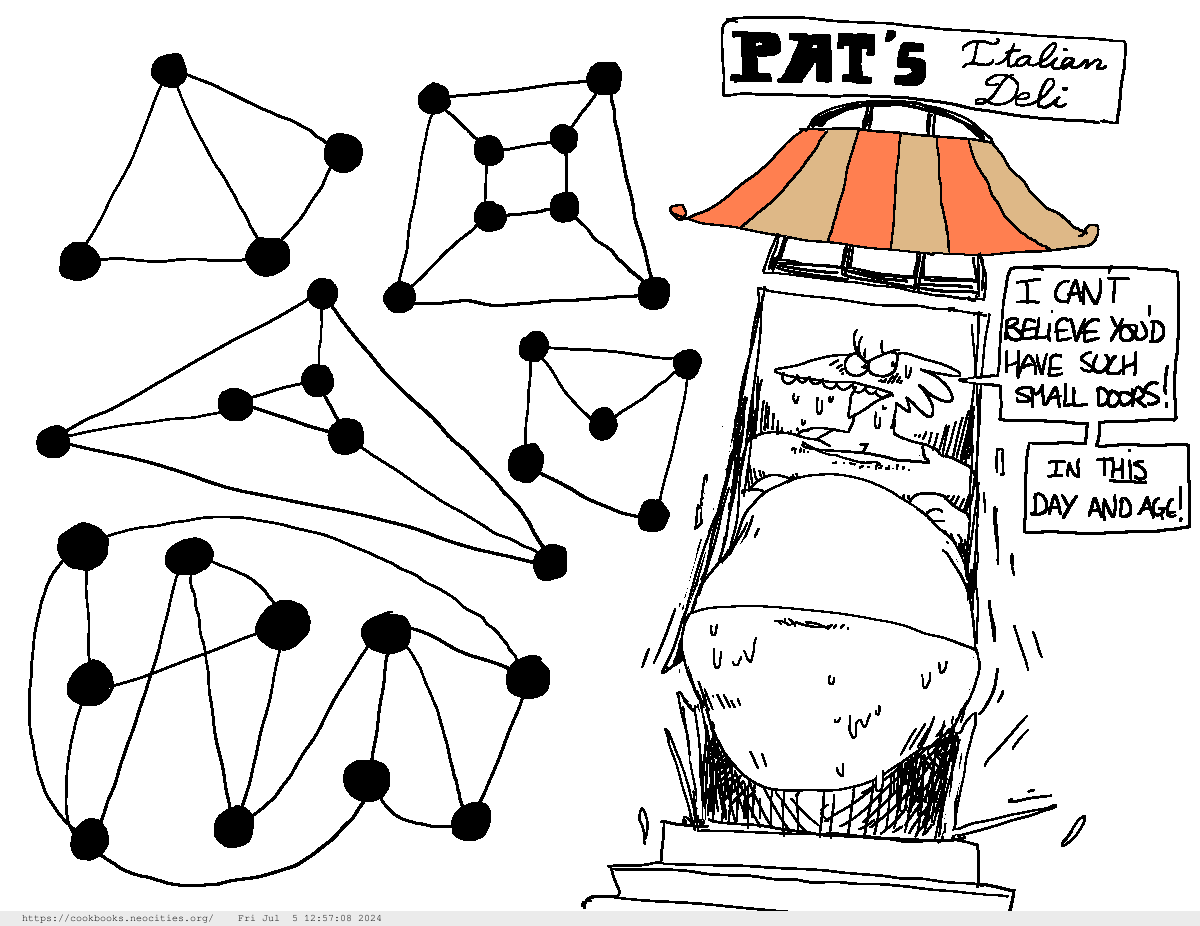
All these graphs are planar, but one. Try to find it!
And if you don't have a general method, you can never really be sure that you haven't missed a drawing of the graph
where no edges cross. So you can never really be sure that the graph isn't planar...
There are, however, methods to know if a graph is planar. But this is out of the scope of this introduction!
Here is a fun little application of planar graphs.
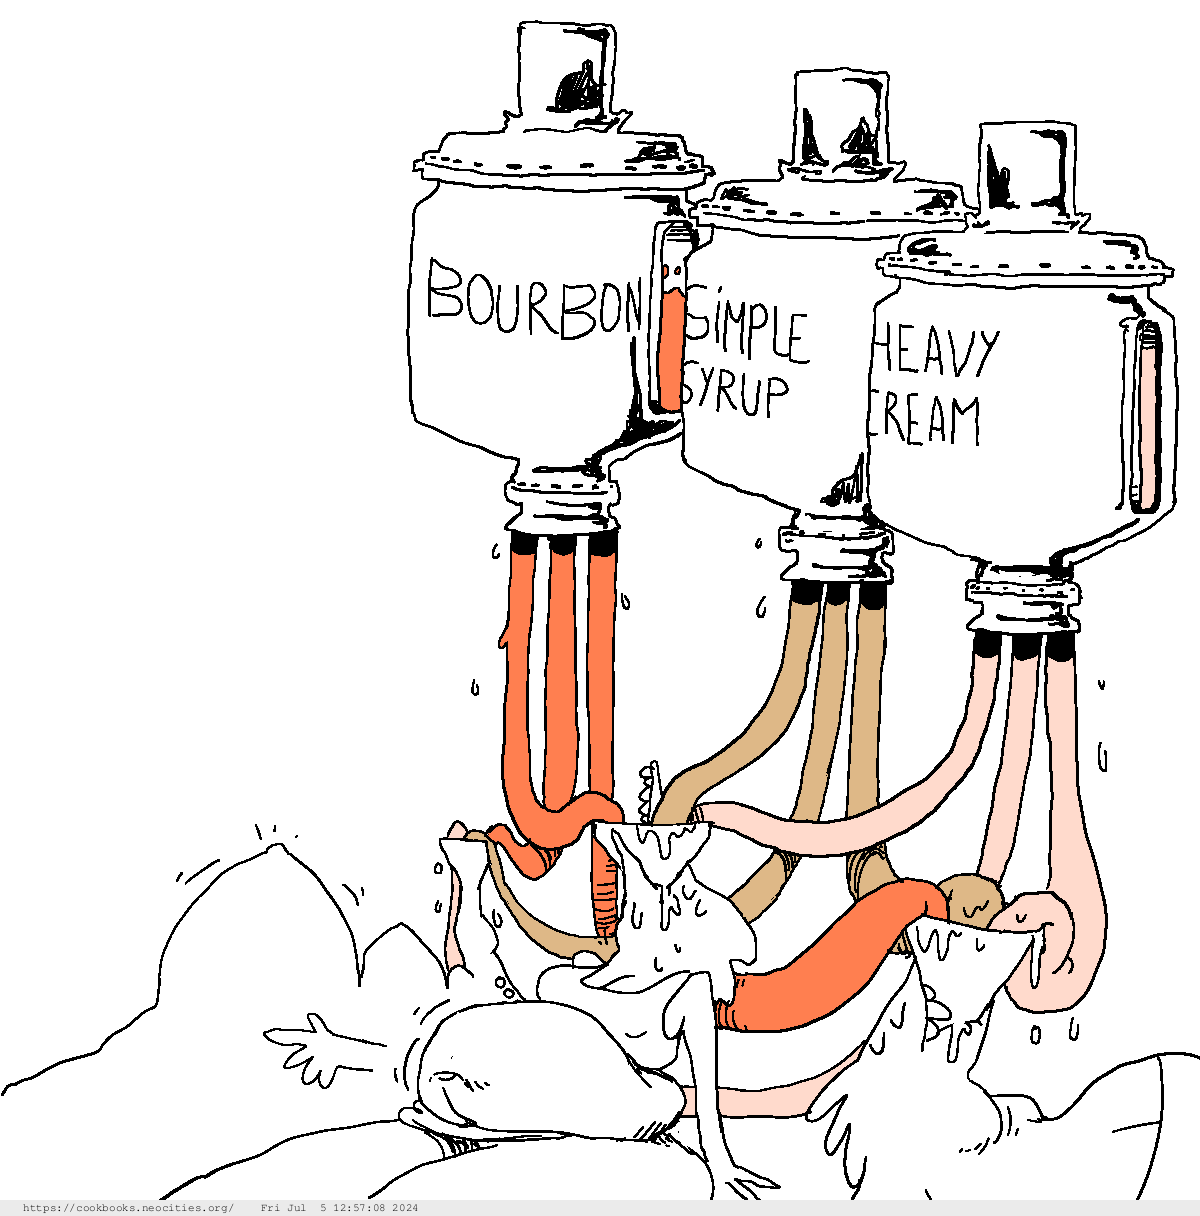
Do you know about the Three Utilities Problem?
It's a popular math puzzle which consists of three houses
and three utilities (water, electricity, and gas).
The goal is to connect each house to each utility via utility lines that do not cross.
In fact, this puzzle has no solution in the plane, and proving this is equivalent to proving that
any graph that is solution is not planar.
(By the way, did you notice that the donut graph is actually the Three Utilities graph?)
Each Karol is connected to each source of food.
Note that in the drawing, the tubes DO cross each other! But with the illusion of 3D given by the drawing,
it seems that they don't.
Another very important application of planar graphs is the design of printed circuits:
the electric connections (edges) that connect the electronic components (nodes)
are often "printed" onto a plane, and you want to avoid ANY unwanted connections (crossing edges)!
The Hand Shaking Lemma
The Hand Shaking Lemma is fun little graph rule which
requires the notion of degrees.
Alright, first question: what the hell's a lemma anyway?
You can understand it as an intermediary mathematical result,
used to prove a theorem (a much bigger, important result).
It's very human-dependant: why would a mathematical result be more important than another?
In an article or in a book, a mathematician can present his main result as a "theorem" (something big and important)
and intermediary results as "lemmas" (which would be closer to tools used to prove the big theorem).
A lemma sometimes gets really famous and very big in the mathematical community,
moreso than things that were originally called theorem, and
sometimes even bigger than the theorem it was supposed to help prove.
A lemma who got big.
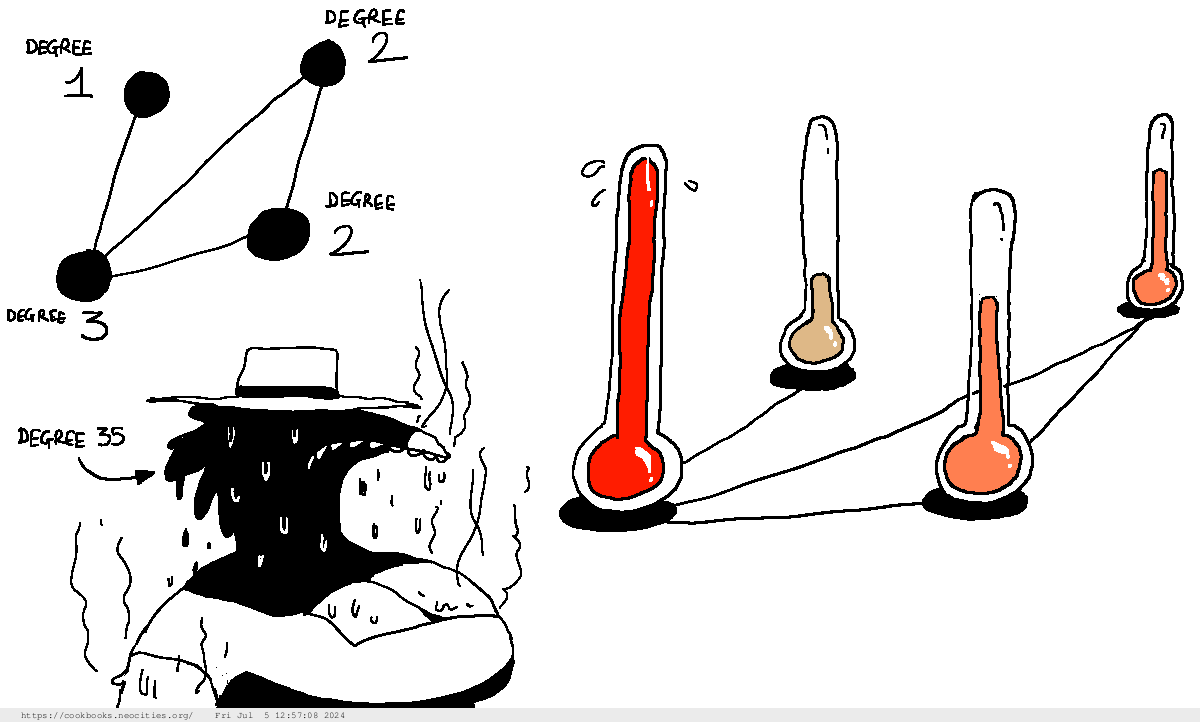
Understood... Then, what's a degree in a graph?
Actually, we talk about the degree of a node: it's the temperature number of
edges it attaches to.
Counting node degrees.
Oh, I get it: counting the degree of a node is kinda like counting how many other nodes
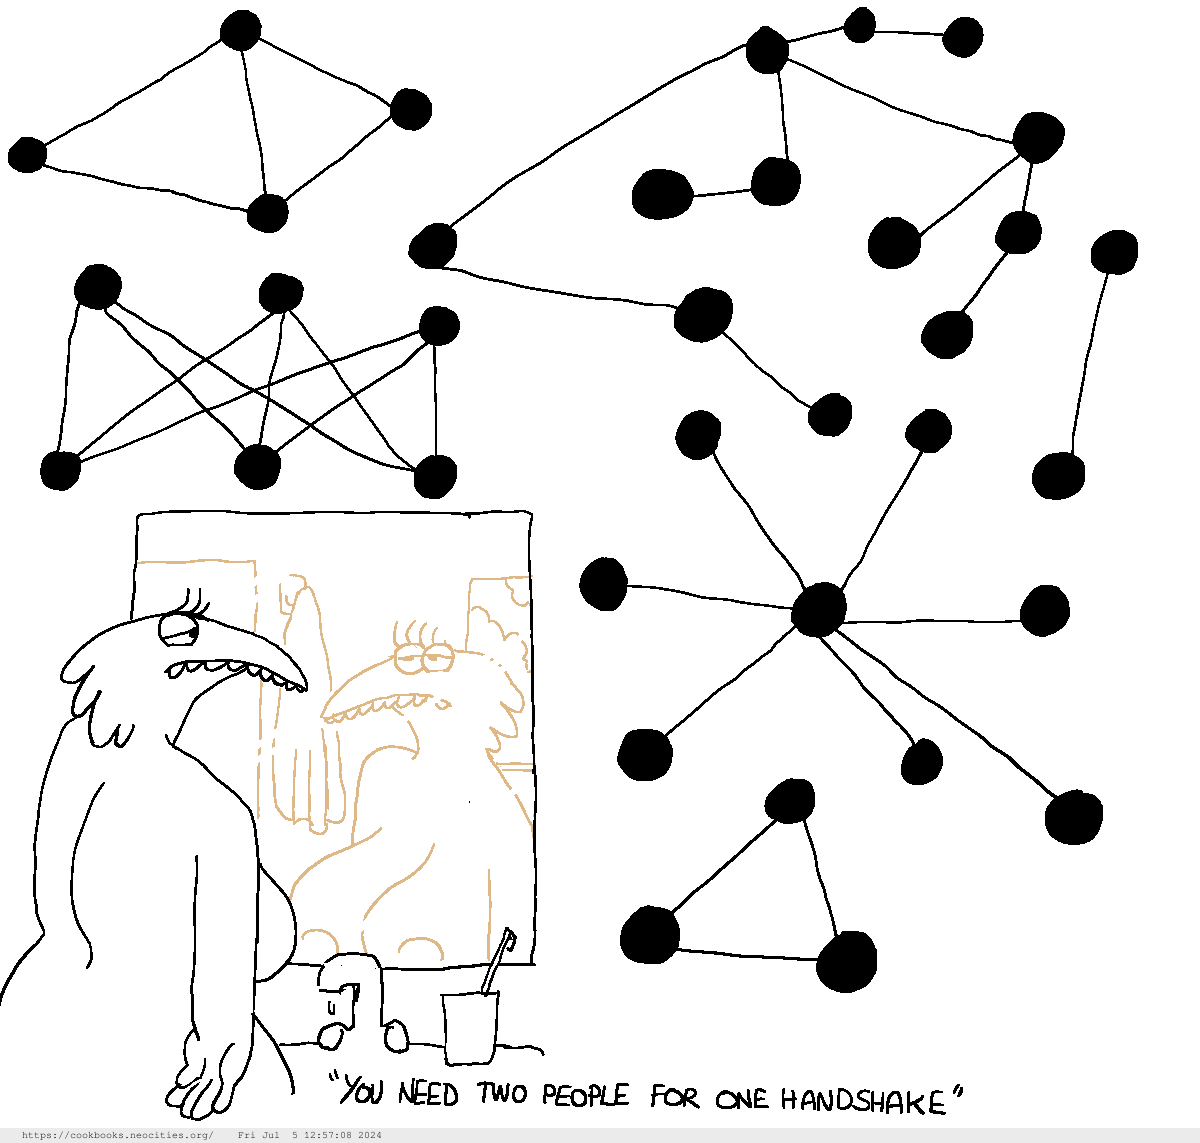
it shakes hands with!
That's it! Nodes are persons (not necessarily with two hands), and the edges are handshakes they make with each other.
See if you can find a relation between
the sum of the degrees of all the nodes in the graphs below, and
the number of edges in the graphs.
Handshakes in different graphs.
2 degrees, 1 edge... 4 degrees, 2 edges... 10 degrees, 5 edges...
The sum is twice the number of edges?
That's exactly right!
In a graph,
The sum of the degrees of all the nodes is twice the number of edges.
Note that we've only checked a few graphs, so we haven't actually discussed the general proof of this fact.
And probably won't, in this introduction to graph theory. But think about it: to form one edge in a graph, you need...
two nodes.
Paths in graphs: Hamilton, and the Travelling Salesman
Remember how I told you that Karol frequently visits "All you can eat" restaurants
but never more than once?
Yes, because she gorges herself to satisfy herself (and you) so much she gets shot on sight.
Most actually just call the cops on her.
So, to visit all the restaurants, she needs to come up with a path that
visits all the restaurants,
only visits them once.
Such a path in a graph, that visits all the nodes exactly once, is called a Hamiltonian path.
If it is a cycle (i.e., you go back at the beginning of your travel), it's called a Hamiltonian cycle.
Try to figure out Hamiltonian paths in these different towns, as raided by Karol.
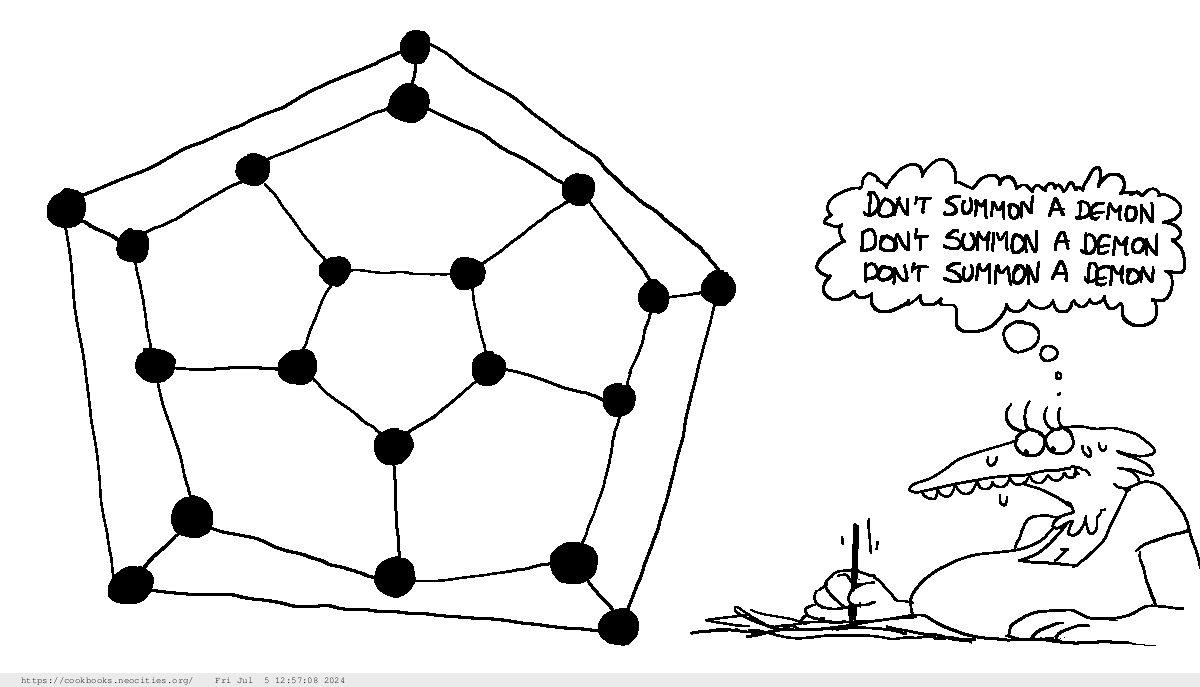
Hamilton's Icosian game (1856) is a popular tabletop game in which
you have to find a Hamiltonian cycle in a particular graph (the graph that represents the edges of a dodecahedron).
A reproduction of the Icosian game. Try to find a Hamiltonian cycle in it!
Finding a path sounds easy enough. You just try to visit all the nodes in the graph, backtracking and revisiting nodes if you need too.
But finding a Hamiltonian path, especially in a big graph...
... is a difficult problem to solve.
Finding a Hamiltonian cycle is also amongst the problems for which it is easy to check if a solution is correct,
but for which actually finding a solution is really hard (in general).
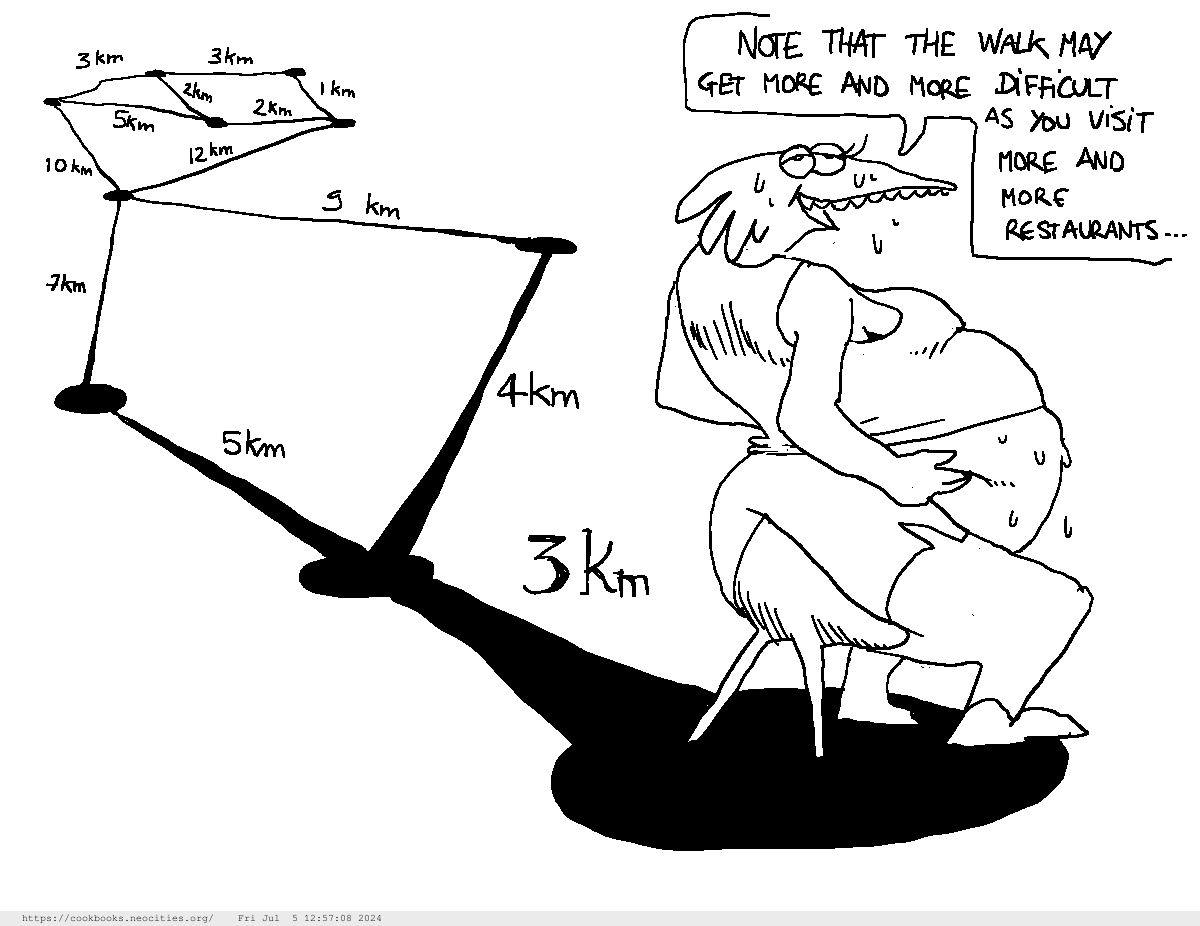
Earlier, you mentioned difficult problems with labelled graphs...
Yes; you can make the problem more complex (but also more accurate to real life)
by including the distances between nodes right on the edges.
With this, you have a barebone google maps model.
Then, you can calculate the lengths of paths!
Exactly! Just add the distances of every edge that is used.
The problem becomes quite complicated when there are several ways of going to the same place
(as in real life, in a map).
The Travelling Salesman is a classic and very much pragmatic problem
that was actually included in a 19th century "Travelling Salesman" book:
what is the SHORTEST route a salesman must take to visit ALL the places he has to visit?
It's also a very complex problem with very concrete applications such as GPS route suggestions.
Graph colorings: the Four Colors Theorem
The last result I want to talk about is about coloring.
I remember the chromatic number, which is... The minimal number
of colors you need to color a graph without the same colors touching?
Exactly! This is another complicated problem to solve in general.
See if you can find the chromatic number of the graphs that correspond to these maps.
So, what's the general rule?
In fact, you need as little as four colors
to color any map without colors touching.
Despite the problem being very simple to state,
it wasn't proven until 1976, and by computer, no less.
This means it still isn't completely accepted...
Computer are distrusted. At least (most) human proofs can be checked by other humans.
By the way, there's also the Five Color Theorem, which is easier to prove and has been since 1890 by
Heawood (human).
Nice references on graph theory
I hope you've enjoyed this introduction to graph theory!
Here are some references to go further.
A basic graph theory lexicon.
Focus more on the ideas than the very specific terms, because sometimes
terminology can change.
Euler's Elementa doctrinae solidorum,
which contain his famous formula that ties up the number of edges, faces, and nodes of certain graphs (in Latin).
Graph theory dates back centuries!
Ed Sandifer's How Euler Did It
(second part here)
about Euler's formula and Euler's errors and half-truths (Everyone makes mistakes by the way).
Do you have any more questions? Things you'd like to see? Things you'd like more of?
I encourage you to post all inquiries here:
Cookbooks Curious Cat.
Remember that ALL questions are interesting.
I will try to answer them at the end, or in the relevant parts of this page.